
Monitor and analyze virtual machine traffic with Flow Monitoring
Flow monitoring is used to capture ingress/egress traffic of VMs in an NSX environment. Flow monitoring is disabled by default, and you need to enable it before you can use this tool. Once Flow monitoring is enabled, you need to wait for some time to let this tool gather data about your vSphere environment (much like how vROPS gathers data before generating reports/recommendations etc)
Flow monitoring can be enabled by navigating to Networking & Security > Flow Monitoring > Configuration and clicking on Enable.
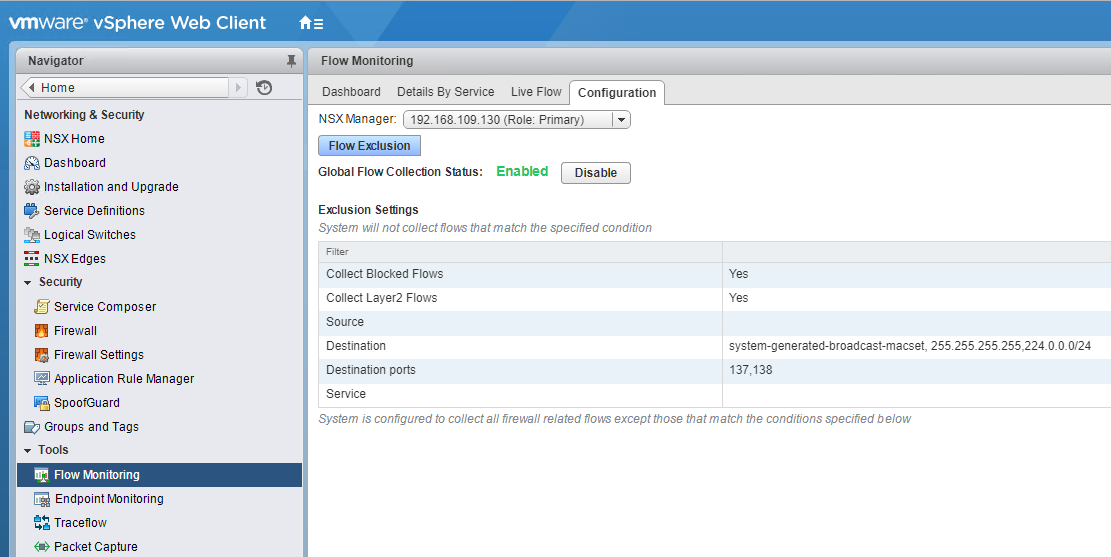
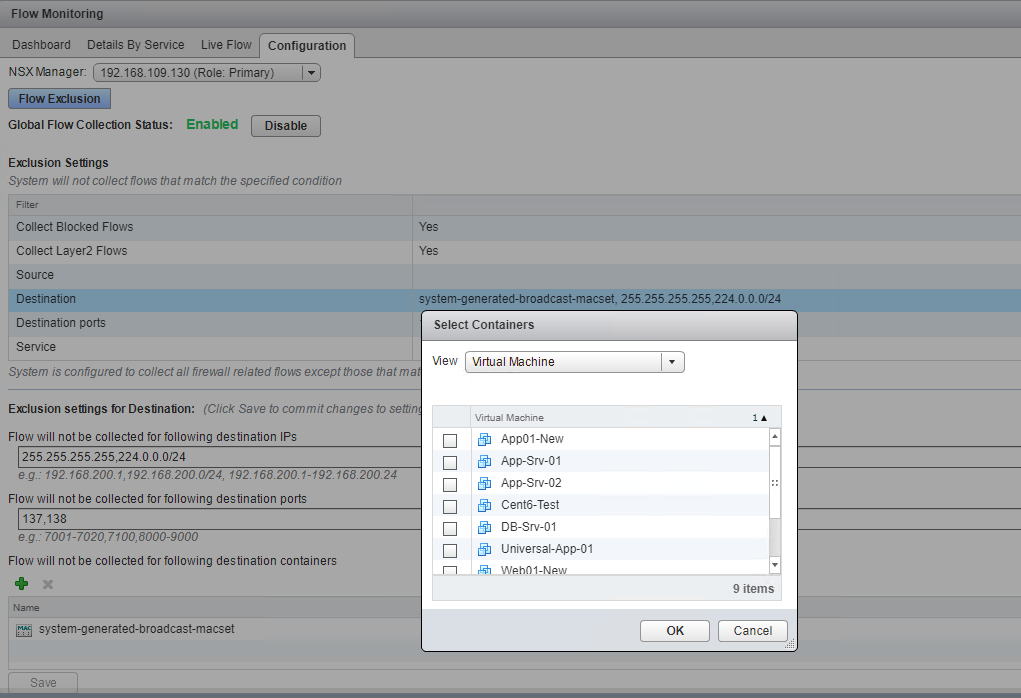
Under Flow Exclusion, you can exclude any object that you don’t want to monitor. For example, you can select the “destination” option under Exclusion Settings and click on the “+” button to specify a destination container for which flow monitoring data won’t be gathered.
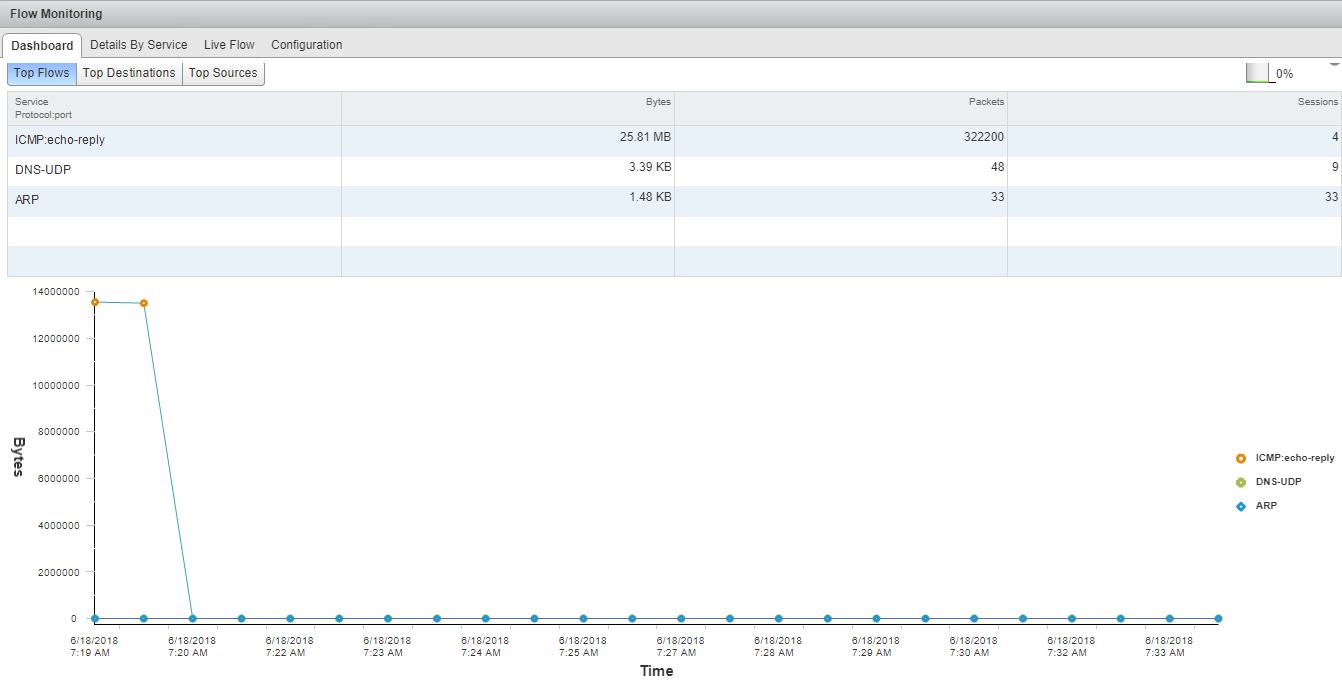
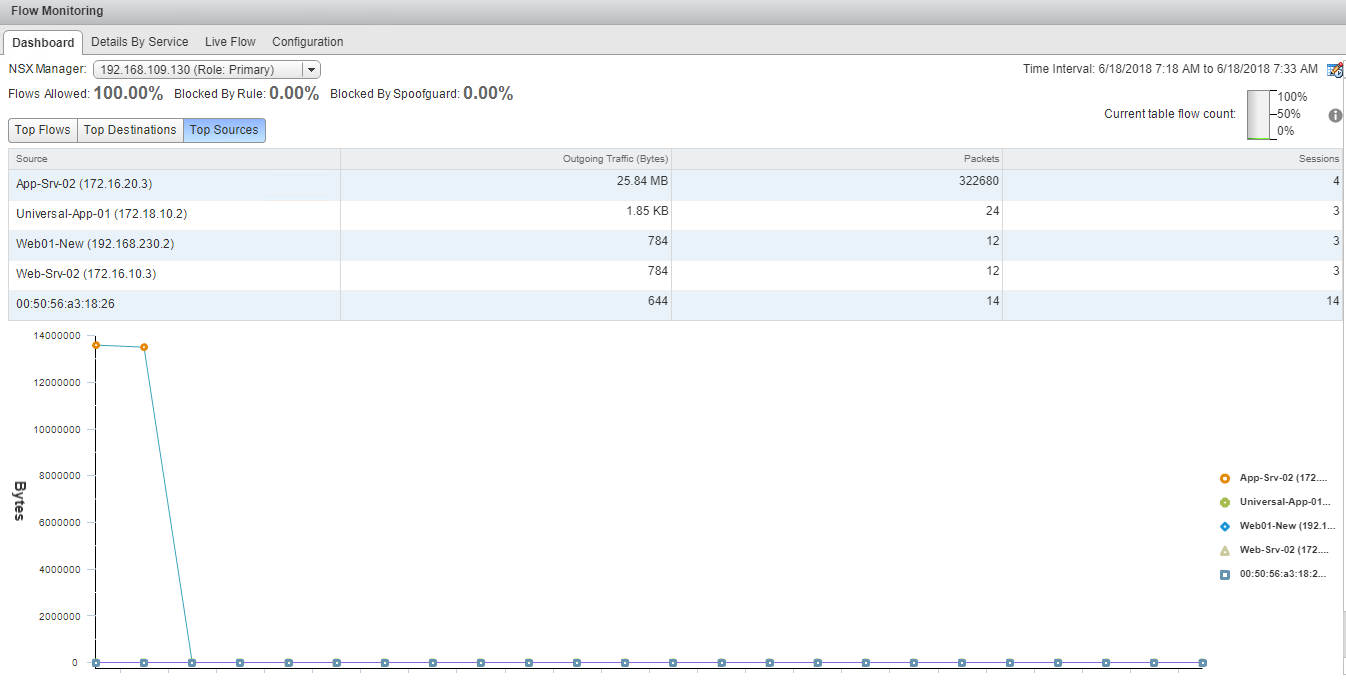
Flow Monitoring Dashboard
Here you can see the top flows, top destinations, and top sources of your environment.
Top Flows: This tab shows the type of traffic (HTTP, ping, DNS, ARP, etc.) that is flowing through your environment.
Since these screenshots were taken from my lab, where nothing much is configured, the top traffic is reported for ICMP.
Top Destinations: This provides a list of destination VMs where most traffic is going. In production, it can be a mail or a web server, or any VM that is accessed by end users frequently.
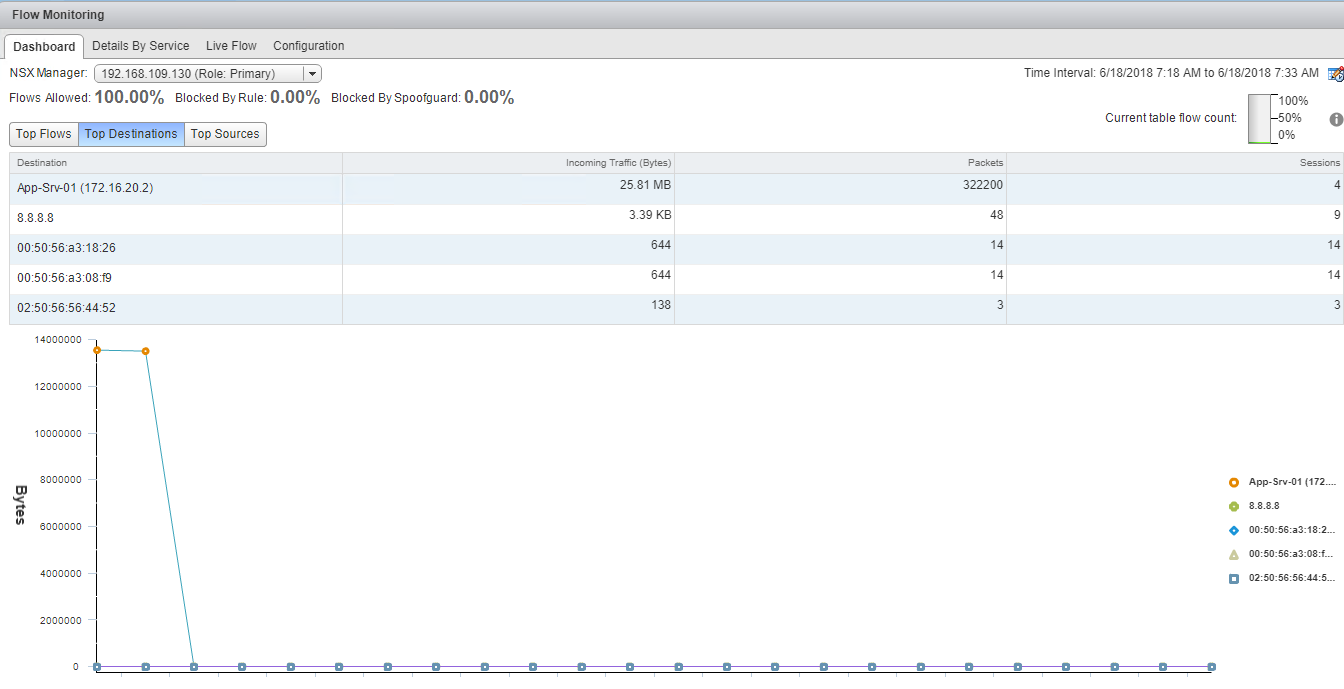
Top Sources: Those VMs that are producing the maximum outgoing traffic.
Details by Service
This tab categorizes the traffic flow based on the type of services being accessed. It will show you the amount of data collected and the number of sessions.
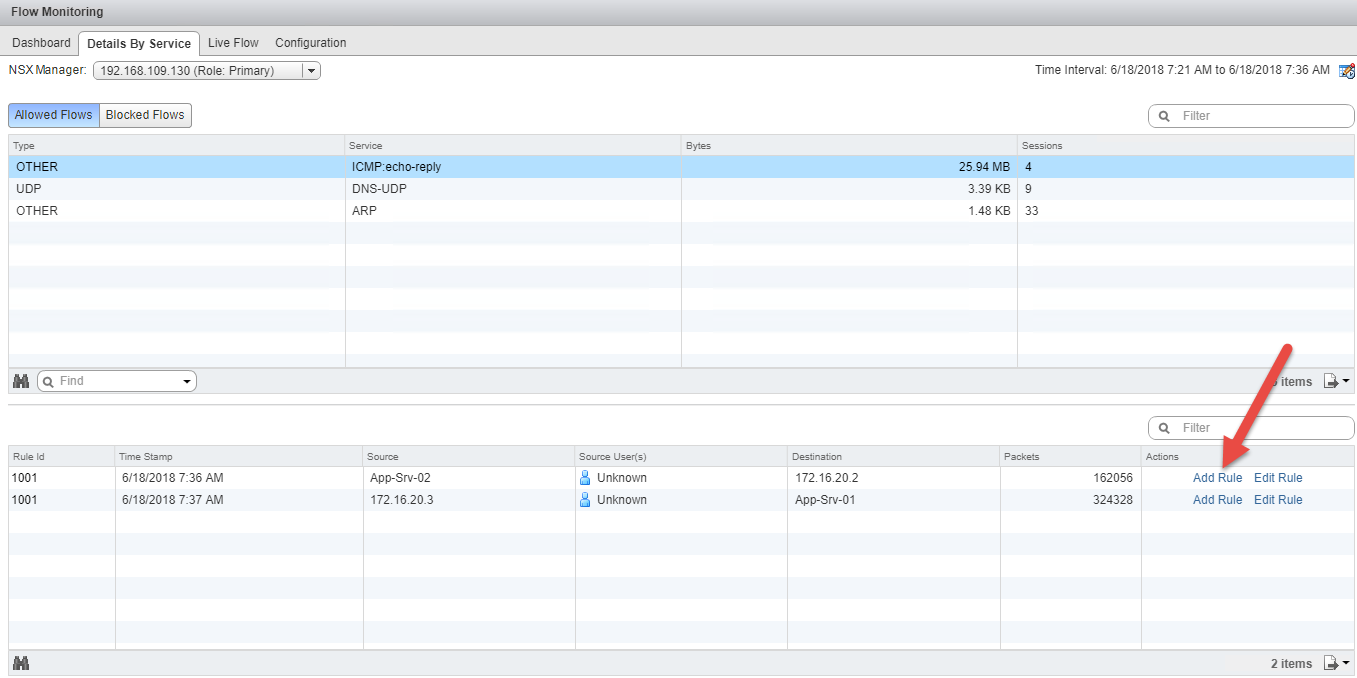
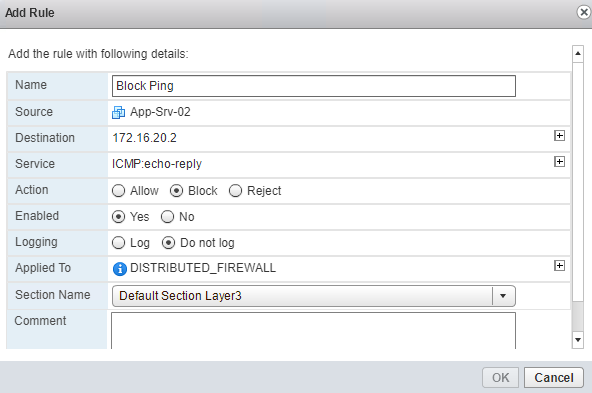
When selecting a service, you can view the traffic from both the source and destination. You can even add a DFW rule by selecting any object and clicking on Add Rule. You can specify whether traffic from a given source will be allowed or blocked.
Live Flow
Live Flow is used to see real-time traffic flow for a specific VM network interface. You can configure the time interval for capturing live traffic, and if a VM has more than one network interface, you can select the NIC for which the flow will be gathered.
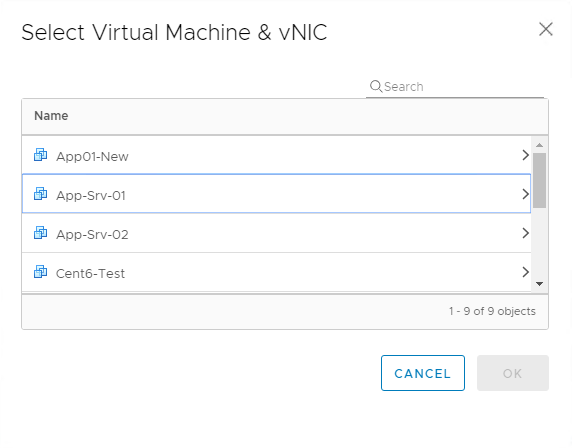
From the Live Flow tab, click on “Select vNIC.”
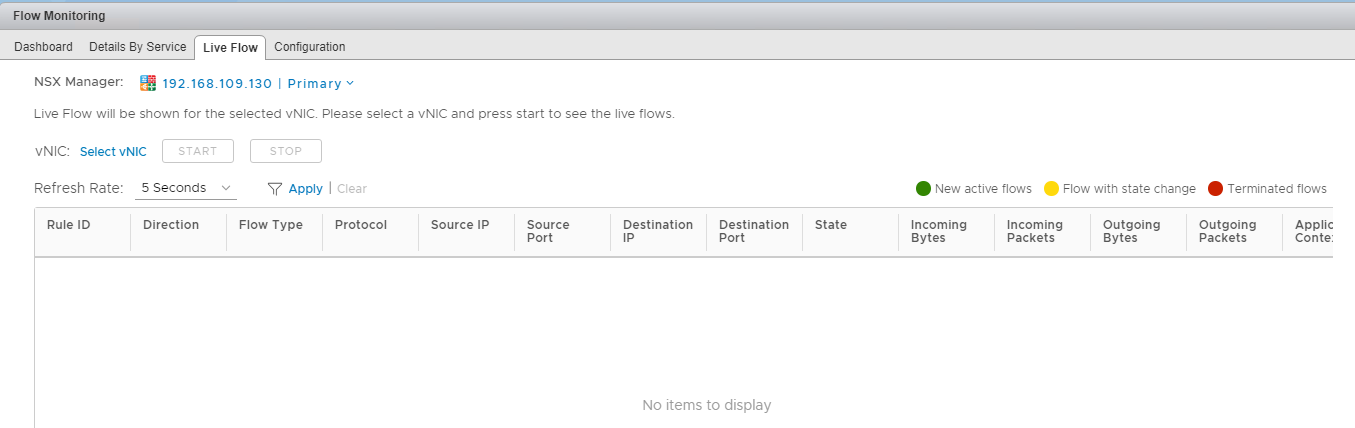
Select a VM from the list and click on the > button to choose a specific NIC.
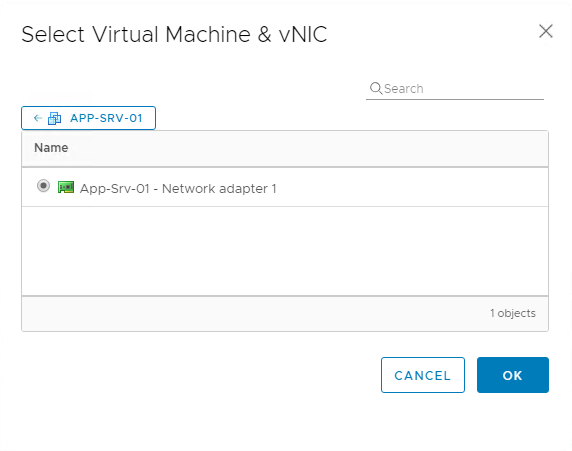
Once a VM NIC is selected, click on the Start button to capture real-time flow.
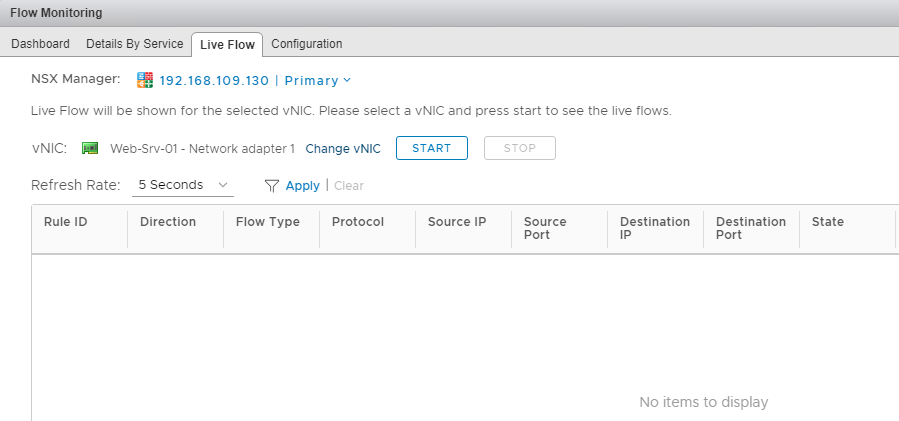
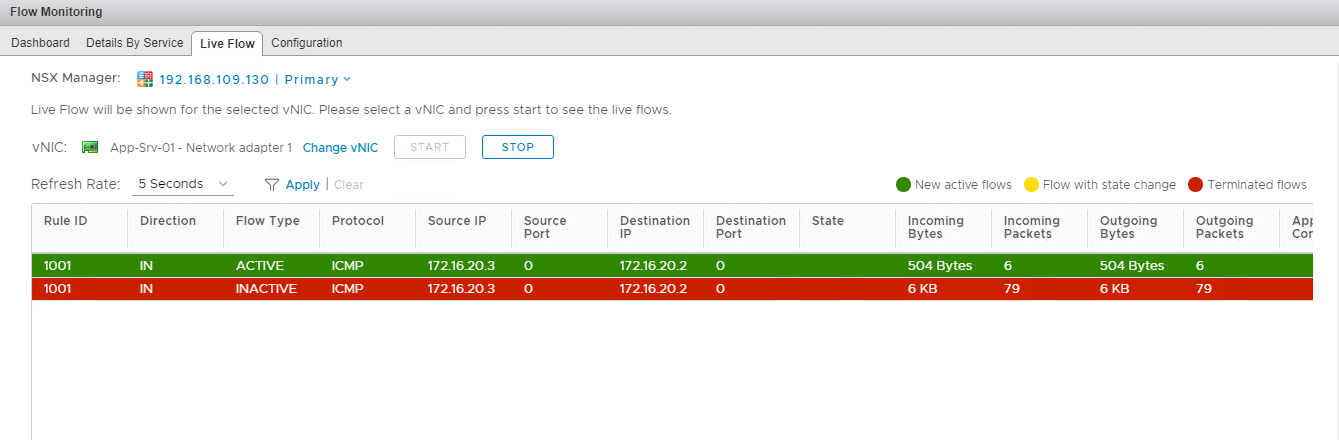
You will see data being populated, and information such as Source IP/Port, Destination IP/Port, Incoming Bytes, Outgoing Bytes, etc., will be displayed on-screen.
In my lab, I initiated a ping from one of my VMs towards a web server, and 2 records were populated here.
Troubleshoot Virtual Machine Connectivity
VMs connected to the same logical switch should be able to communicate with each other. If they are not communicating, then it means you have made some configuration mistakes. Common things that you can check for troubleshooting this issue are
- Ensure the VMs that you are trying to communicate with each other have IP addresses from the same subnet.
- The firewall running inside the guest OS is not blocking ICMP.
- The NIC cards of both VMs should be connected.
- VMs should be in the same cluster that you connected to the transport zone. If the VMs are in different clusters, ensure both clusters are added to the transport zone where you created the virtualwire.
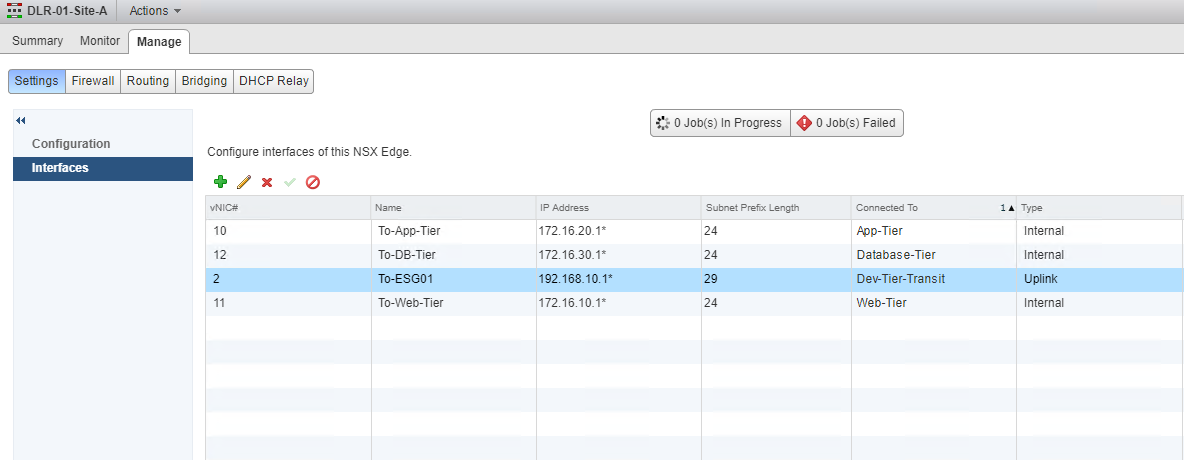
To establish communication between 2 logical switches, you need a DLR. Logical switches are added to DLR as an internal interface (LIF), and while adding the LIFs, you specify an IP address for that LIF. This IP address acts as the gateway IP for all VMs connected to that LIF.
If you are unable to ping between 2 VMs that reside on different logical switches, then ensure the following:
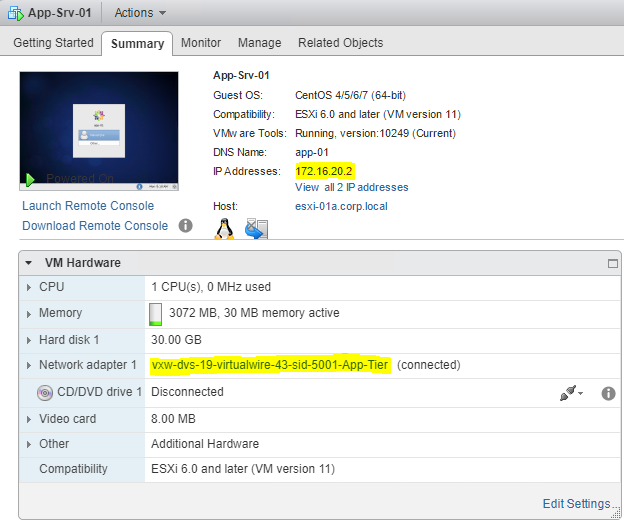
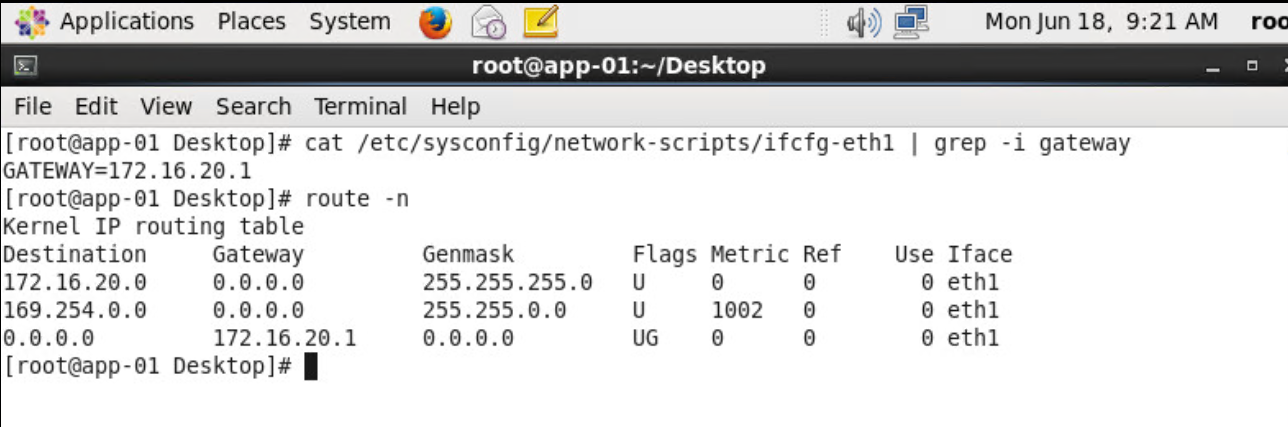
The VM’s IP address should match the subnet IP that you added on the LIF, and that IP is set as the default gateway inside the guest OS. Refer to the screenshots below
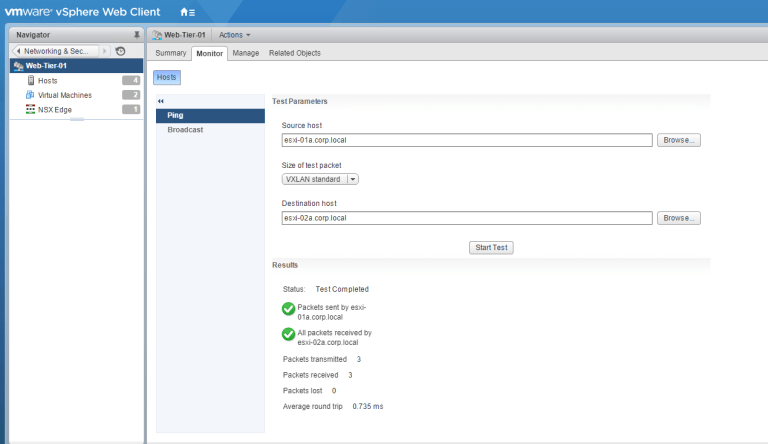
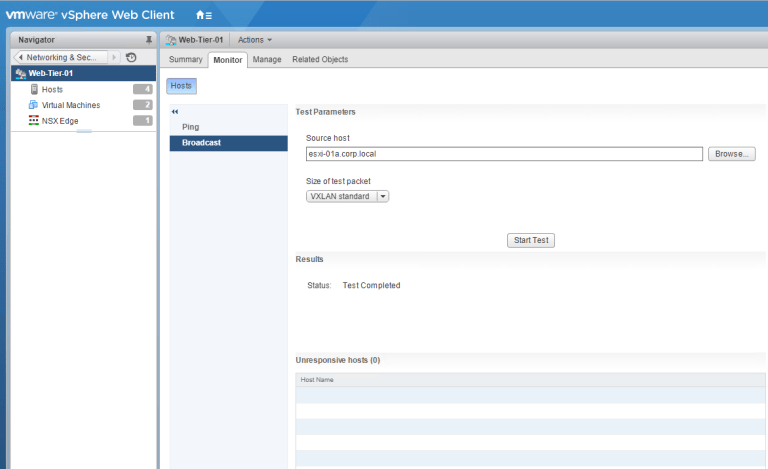
You can also test logical switch connectivity by double-clicking on a logical switch, and from the Monitor tab, you can test for ping and broadcast packets.
Select the source and destination host by clicking the browse button, and click “Start Test.”
If the test is successful, you will see similar results shown below.
Troubleshoot dynamic routing protocols
You can configure dynamic routing like OSPF, BGP, and IS-IS on NSX edges, DLR, and/or between other network components. If the routing is not working as expected between the 2 devices, then you can use the commands below to debug and troubleshoot routing issues.
Case 1: BGP is configured between DLR and NSX Edge
In my lab, NSX Edge is distributing routes for network 192.168.20.0/29 via BGP to DLR, and DLR is distributing 172.16.10.0/24, 172.16.10.0/24, 172.16.20.0, and 172.16.30.0/24 to ESG. I ran the following commands to verify routing is working as expected.
Verify BGP Neighbor
|
1 2 3 4 5 6 7 8 9 10 11 12 13 14 15 16 17 18 19 |
DLR-01-Site-A-0> show ip bgp neighbor BGP neighbor is 192.168.10.2, remote AS 65001, BGP state = Established, up Hold time is 180, Keep alive interval is 60 seconds Neighbor capabilities: Route refresh: advertised and received Address family IPv4 Unicast:advertised and received Graceful restart Capability:advertised and received Restart remain time: 0 Received 22665 messages, Sent 22642 messages Default minimum time between advertisement runs is 30 seconds For Address family IPv4 Unicast:advertised and received Index 1 Identifier 0x8ba77cc4 Route refresh request:received 0 sent 0 Prefixes received 3 sent 4 advertised 4 Connections established 2, dropped 2 Local host: 192.168.10.3, Local port: 55092 Remote host: 192.168.10.2, Remote port: 179 |
|
1 2 3 4 5 6 7 8 9 |
DLR-01-Site-A-0> show ip bgp neighbors summary Codes: I-Idle, C-Connect, OS-OpenSent, OC-OpenConfirm, A-Active, E-Established BGP summary information for VRF default Router ID: 192.168.10.1 Local AS: 65001 Neighbor AS UpDown InMsgs OutMsgs InPfx OutPfx Flaps E 192.168.10.2 65001 1w6d 22665 22642 3 4 1 |
Verify routes learned via BGP
|
1 2 3 4 5 6 7 8 |
DLR-01-Site-A-0> show ip route bgp Codes: O - OSPF derived, i - IS-IS derived, B - BGP derived, C - connected, S - static, L1 - IS-IS level-1, L2 - IS-IS level-2, IA - OSPF inter area, E1 - OSPF external type 1, E2 - OSPF external type 2, N1 - OSPF NSSA external type 1, N2 - OSPF NSSA external type 2 B 192.168.20.0/29 [200/0] via 192.168.10.2 |
|
1 2 3 4 5 6 7 8 9 10 11 12 13 14 15 |
DLR-01-Site-A-0> show ip route Total number of routes: 7 Codes: O - OSPF derived, i - IS-IS derived, B - BGP derived, C - connected, S - static, L1 - IS-IS level-1, L2 - IS-IS level-2, IA - OSPF inter area, E1 - OSPF external type 1, E2 - OSPF external type 2, N1 - OSPF NSSA external type 1, N2 - OSPF NSSA external type 2 S 0.0.0.0/0 [1/0] via 192.168.10.2 C 172.16.10.0/24 [0/0] via 172.16.10.1 C 172.16.20.0/24 [0/0] via 172.16.20.1 C 172.16.30.0/24 [0/0] via 172.16.30.1 C 192.168.10.0/29 [0/0] via 192.168.10.3 B 192.168.20.0/29 [200/0] via 192.168.10.2 C 192.168.109.0/24 [0/0] via 192.168.109.240 |
Verify Forwarding Table
|
1 2 3 4 5 6 7 8 9 10 11 |
DLR-01-Site-A-0> show ip forwarding Codes: C - connected, R - remote, > - selected route, * - FIB route R>* 0.0.0.0/0 via 192.168.10.2, vNic_2 C>* 172.16.10.0/24 is directly connected, VDR C>* 172.16.20.0/24 is directly connected, VDR C>* 172.16.30.0/24 is directly connected, VDR C>* 192.168.10.0/29 is directly connected, vNic_2 R>* 192.168.20.0/29 via 192.168.10.2, vNic_2 C>* 192.168.109.0/24 is directly connected, vNic_0 |
Important: When configuring BGP between a DLR and ESG, be sure to use the protocol address for establishing BGP neighborship. If you use DLR’s forwarding address in place of the protocol address, routes won’t be learnt between ESG and DLR
Case 2: OSPF configured between 2 NSX edges: You can run the following commands on both edges to troubleshoot OSPF issues
Verify OSPF Neighbors.
|
1 2 3 |
Peri-GW01-0> show ip ospf neighbors NeighborID Pri Address DeadTime State Interface 192.168.20.1 128 192.168.20.1 32 Full/DR/1w6d vNic_1 |
Verify if routes are being learnt or not via OSPF
|
1 2 3 4 5 6 7 8 9 10 11 12 13 14 15 |
Peri-GW01-0> show ip route Total number of routes: 7 Codes: O - OSPF derived, i - IS-IS derived, B - BGP derived, C - connected, S - static, L1 - IS-IS level-1, L2 - IS-IS level-2, IA - OSPF inter area, E1 - OSPF external type 1, E2 - OSPF external type 2, N1 - OSPF NSSA external type 1, N2 - OSPF NSSA external type 2 S 0.0.0.0/0 [1/0] via 192.168.109.1 O E2 172.16.10.0/24 [110/0] via 192.168.20.1 O E2 172.16.20.0/24 [110/0] via 192.168.20.1 O E2 172.16.30.0/24 [110/0] via 192.168.20.1 O E2 192.168.10.0/29 [110/0] via 192.168.20.1 C 192.168.20.0/29 [0/0] via 192.168.20.2 C 192.168.109.0/24 [0/0] via 192.168.109.241 |
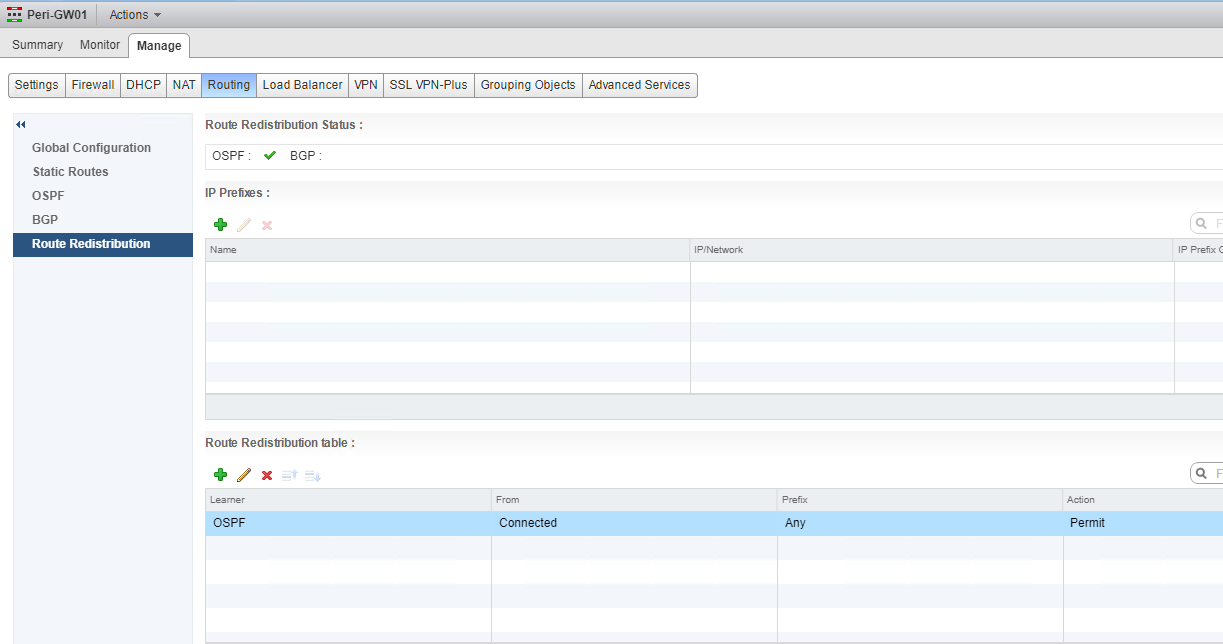
If you have verified that your OSPF/BGP configuration is correct on both sides, make sure that you are advertising the routes. It’s a common mistake to forget to configure route redistribution after configuring the dynamic routing protocol. Route Redistribution is configured under NSX Edge > Manage > Routing > Route Redistribution.
And that’s it for this post.
I hope you find this post informative. Feel free to share this on social media if it’s worth sharing.