
Welcome to the 8th part of the VMware vDefend SSP series. In the previous post, I discussed the SSP Security Journey workflow and its stages. This post will showcase segmentation planning, which is a sub-feature of security intelligence.
If you are not following along with this series, I encourage you to read the earlier parts of this series from the links below:
1: Introduction to VMware vDefend Security Services Platform
2: Deploy & Configure SSP Instance
3: Onboard NSX Manager & Activate Platform Features
4: SSP Integration with Core Infrastructure Services
6: Security Segmentation Report
7: Security Intelligence Overview
In the previous post, we saw that the security journey is a staged workflow, with each stage providing a different capability. After you complete a stage, you must mark it as completed and move to the next stage.
Note: I covered stage 1 in the 6th part of this series, so I am not repeating the steps.
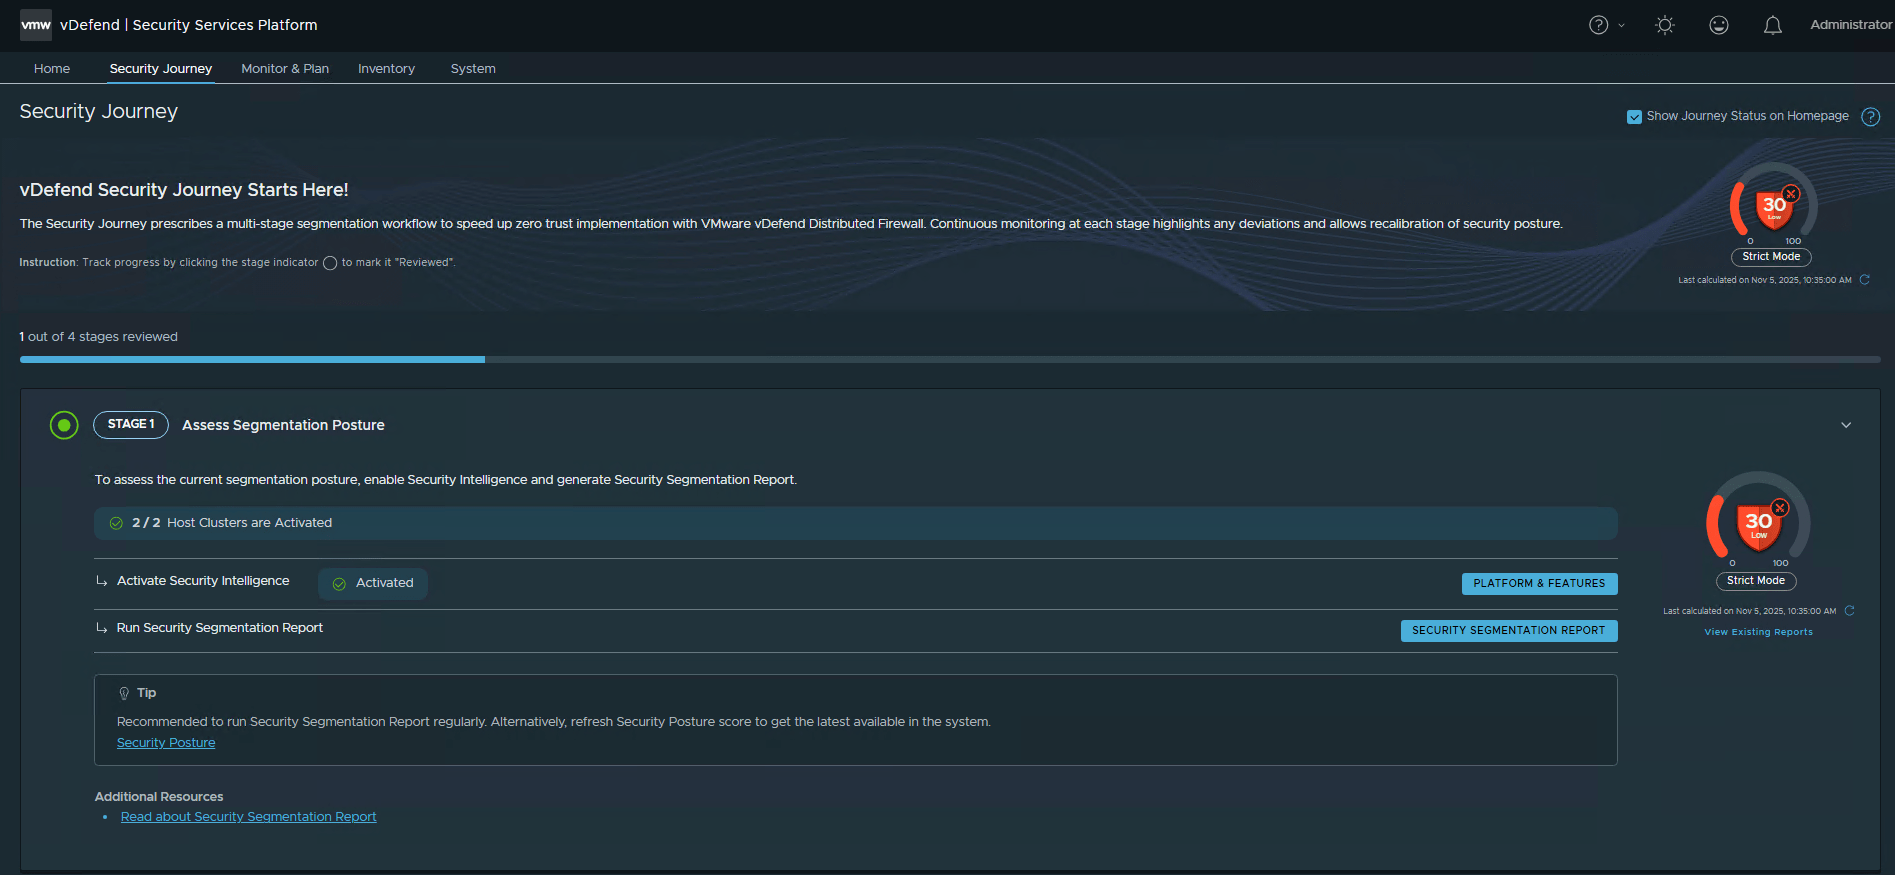
Stage 2: Segmentation Planning
Segmentation planning allows users to import application context via a CSV file containing key workload attributes such as IP addresses, subnets, VMs, and logical segments. The objective is to create a zero-trust environment that eliminates unwanted traffic and permits only explicitly authorized communications.
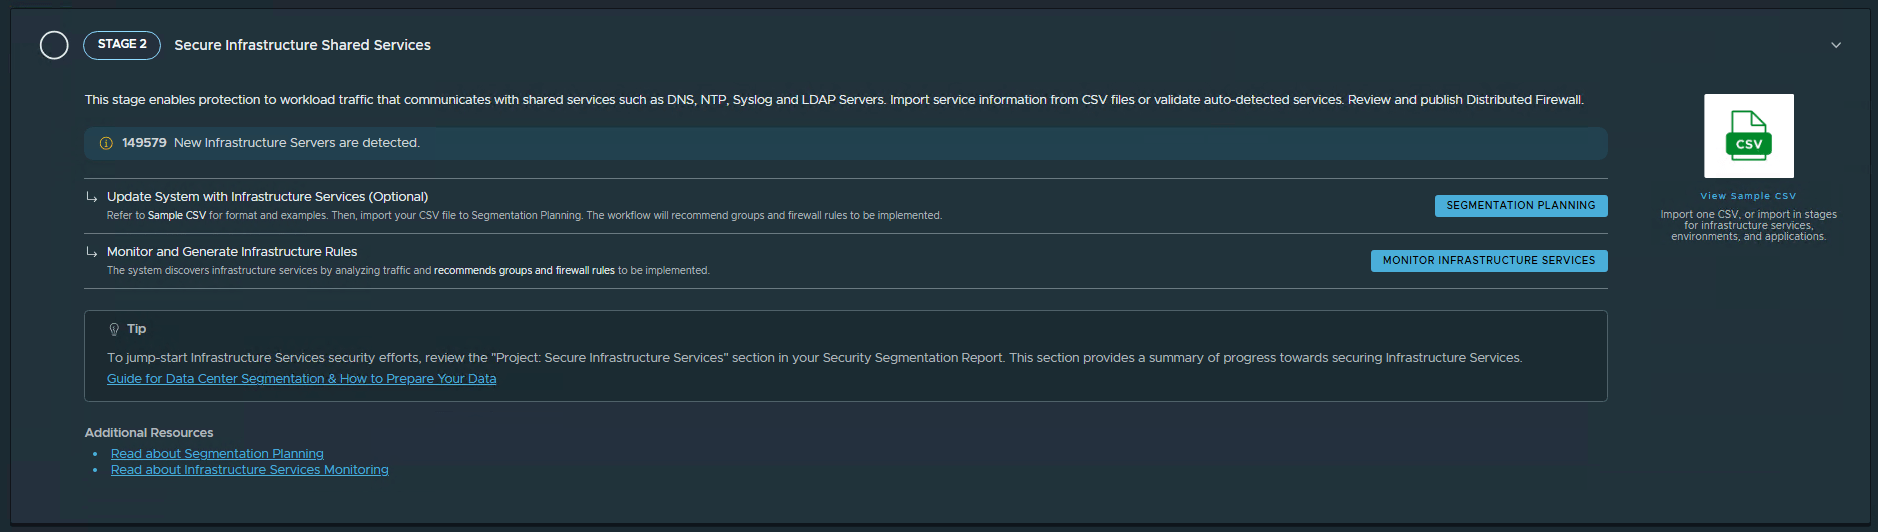
Stage 2 focuses on securing core and shared infrastructure services, such as DNS, LDAP, NTP, Syslog, and more. In a VCF-based private cloud, this stage also helps in protecting critical VCF components (SDDC Manager, vCenter, and NSX Managers).
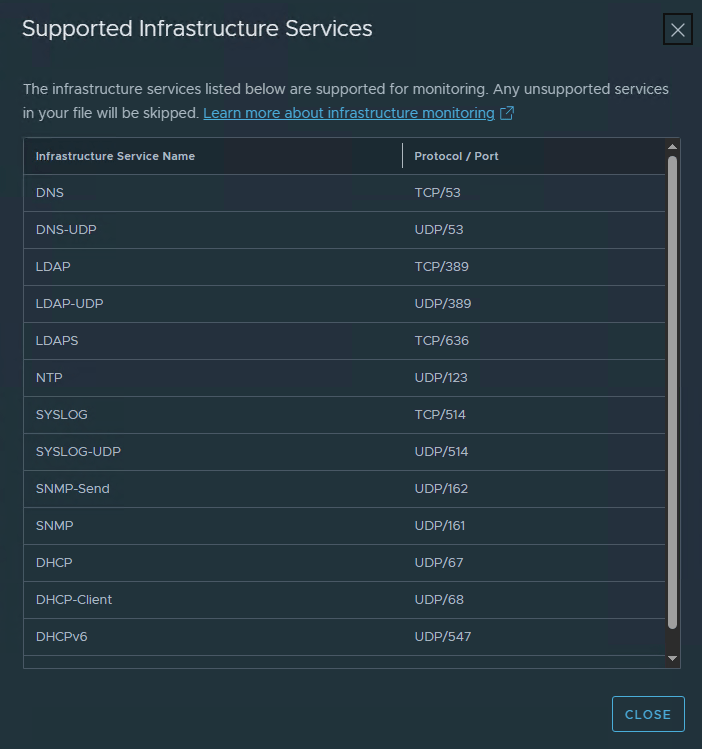
Security Intelligence supports 14 infrastructure services, enabling administrators to define rules that permit workload access to these essential services.
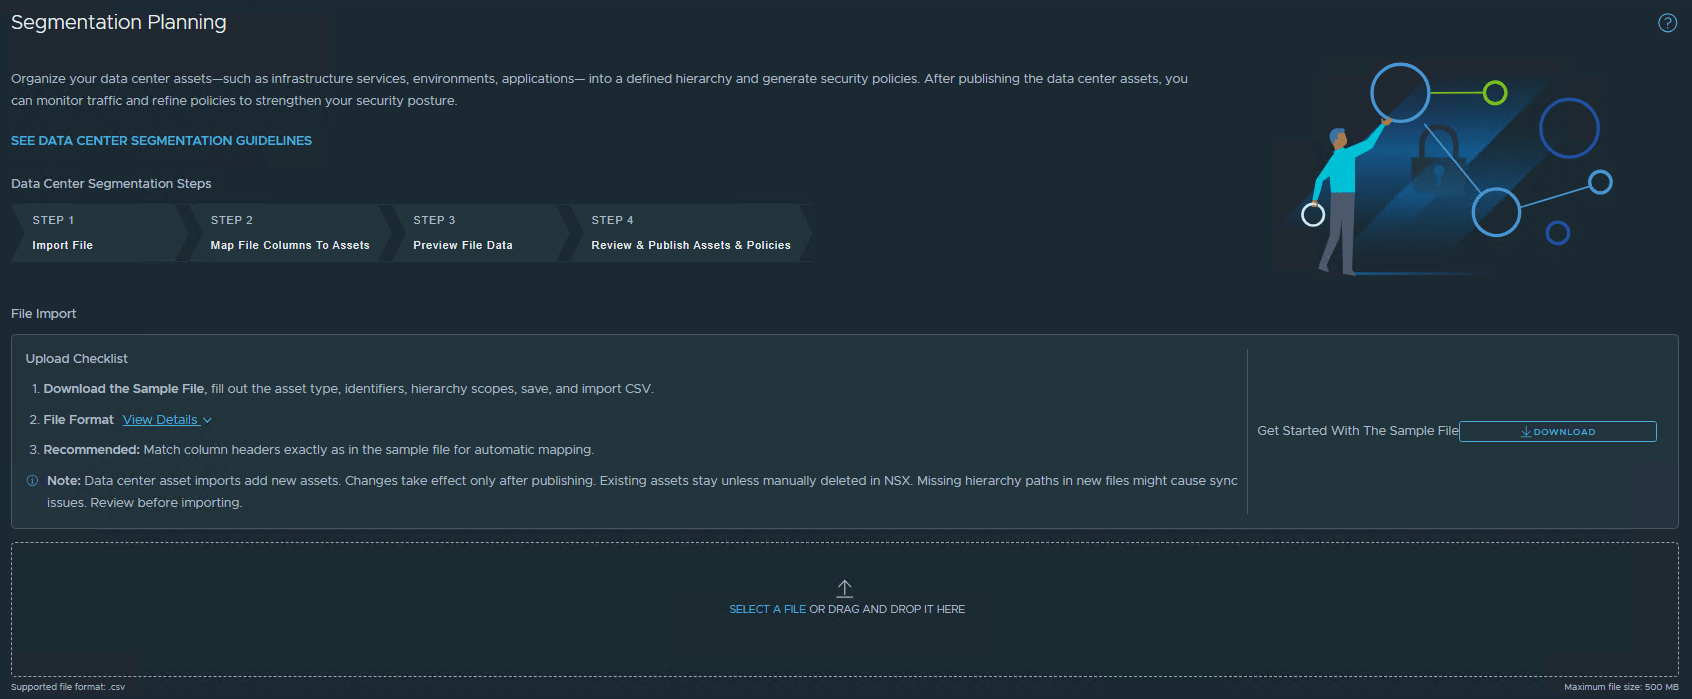
Stage 2 relies on CSV ingestion, where you upload a CSV workbook containing infrastructure assets. The CSV files help you organize inventory assets such as regions, environments, and applications into a defined hierarchy, then generate and publish associated security policies for infrastructure services and environments to NSX Manager.
Unlike other assets, infrastructure services are not part of the hierarchy. Instead, they are organized into dedicated groups where users can create and apply policies independently.
Note: SSP provides a sample CSV that you can download and fill out.
The image below shows the content of the sample CSV.

Note: To know more about the supported object types in CSV and how to fill them, see the product documentation
The image below, taken from the Broadcom documentation, shows a filled sample CSV.
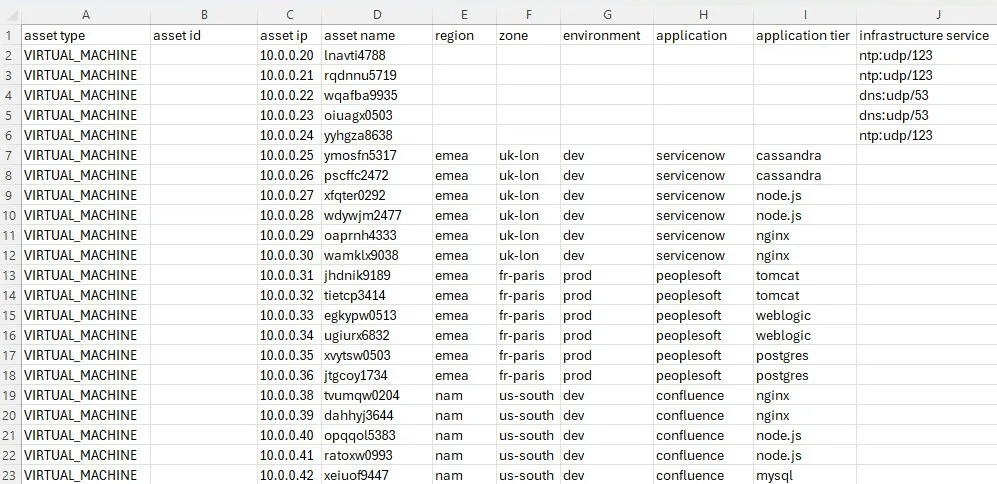
After you complete filling in the CSV file, click the Segment Planning button and upload it.
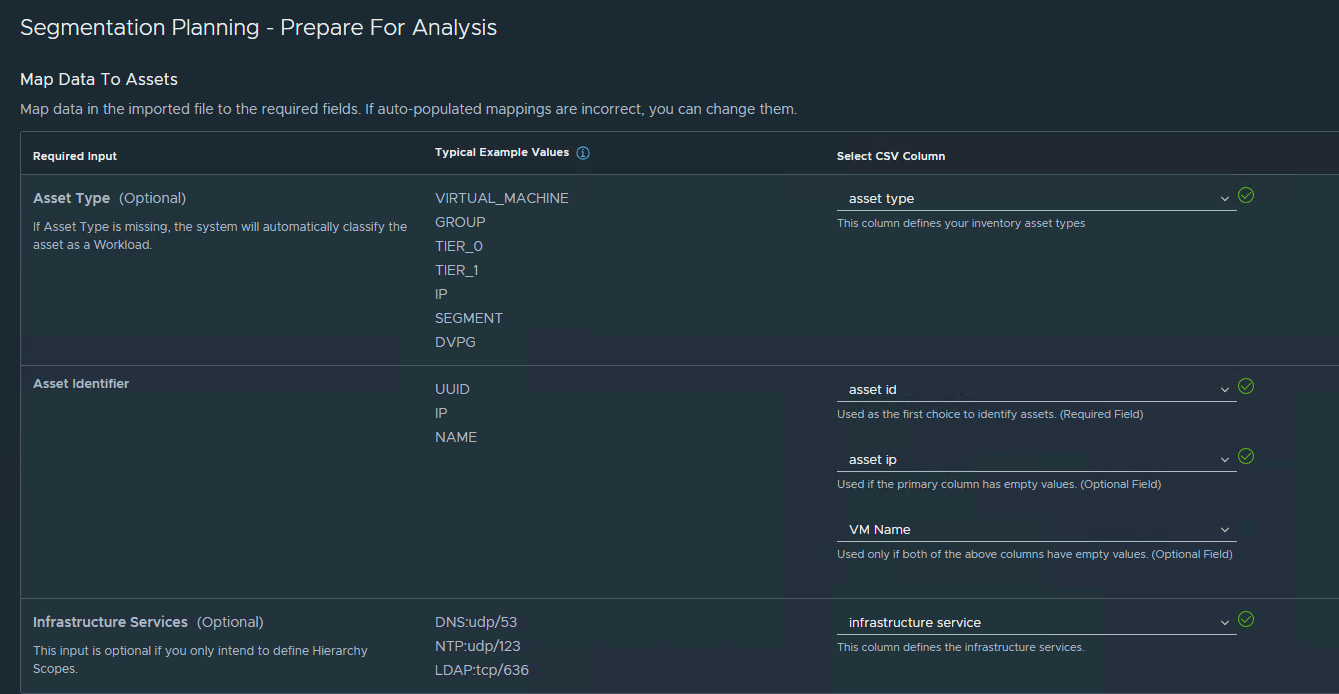
Review and validate the auto-populated column mappings.
During the CSV import, if your column headers differ from the standard headers in the sample CSV, the fields will appear blank. You must manually map each column header to its corresponding standard header.
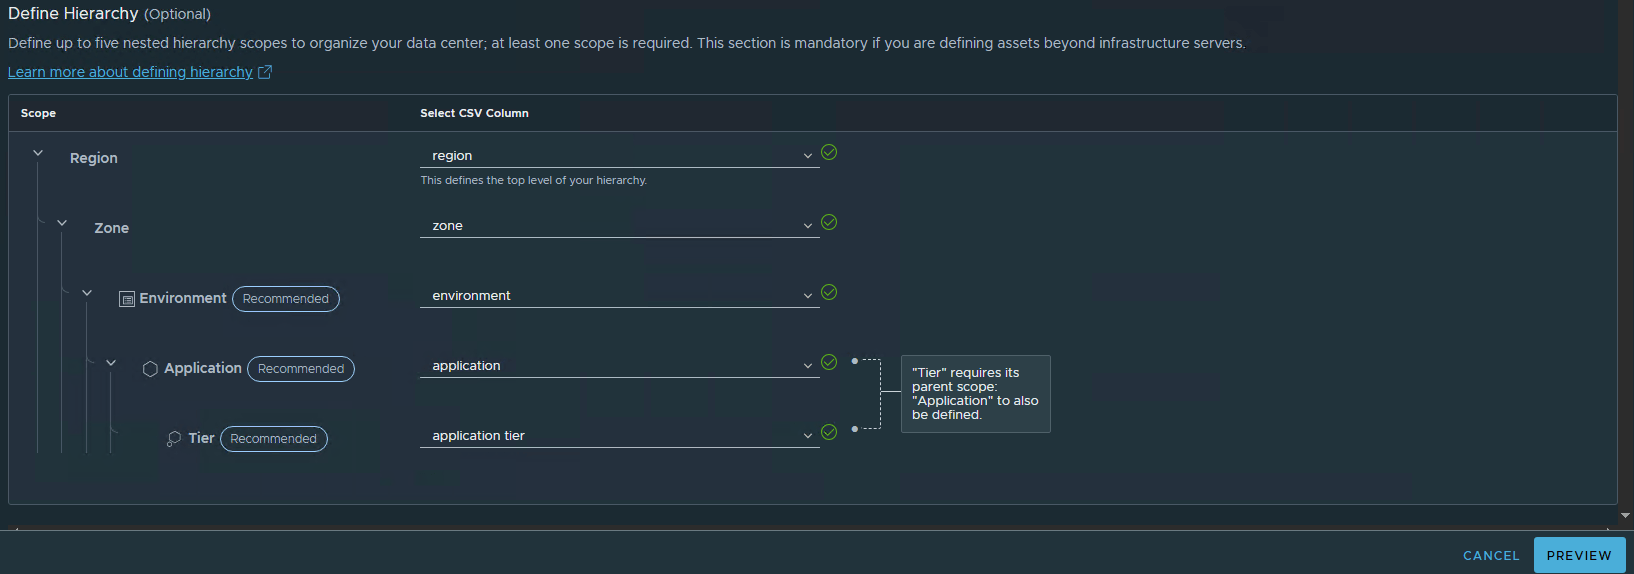
Click “Preview” to prepare for analysis.
If the CSV file contains any errors causing the mapping to fail, you’ll see an error notification with a link to download an annotated CSV highlighting the issues. Download the annotated file, correct the errors, and upload the revised file for preview before proceeding with the analysis.
Alternatively, you can continue with the analysis without corrections, and the system will exclude the incorrect data.
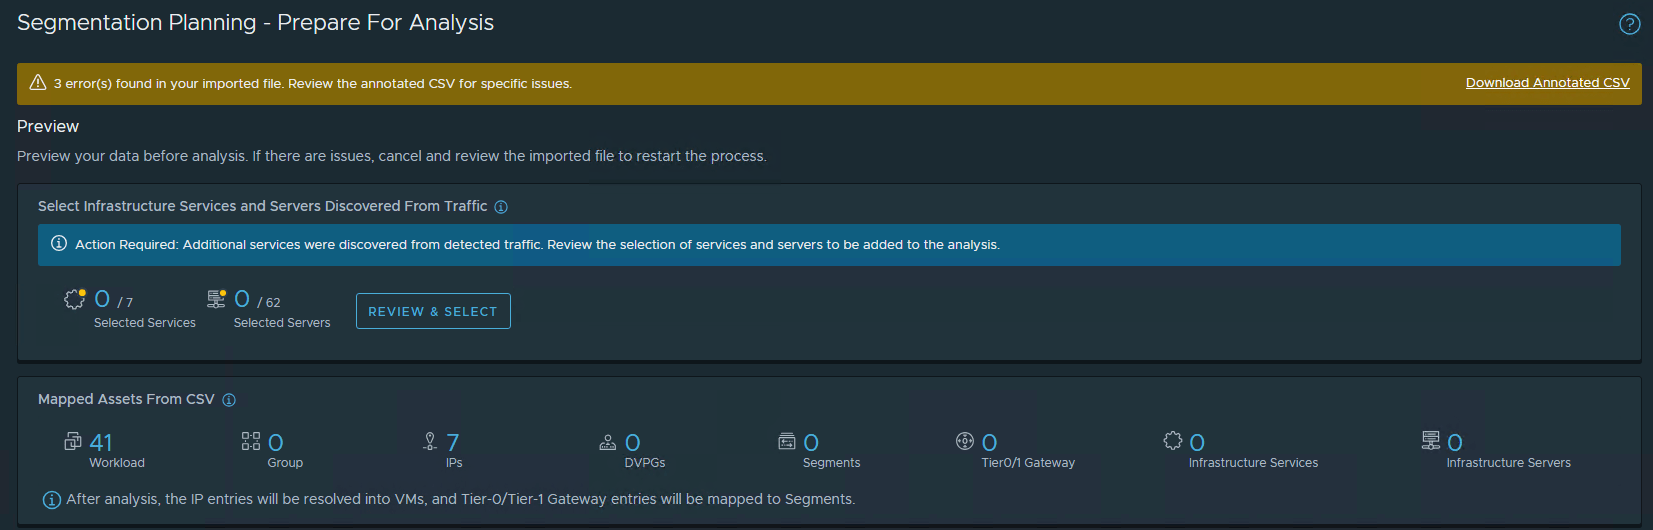
SSP discovers the following object types:
1: Infrastructure Services and Servers: Shows the combined total of infrastructure services and servers from both the CSV file and those discovered by Security Intelligence through traffic flow analysis.
2: Mapped Unique Assets: Lists the total number of workloads, groups, IP addresses, DVPGs, segments, tiers, infrastructure services, and infrastructure servers.
After the segmentation analysis completes, the system maps IP addresses to VMs and maps Tier-0 and Tier-1 information to their corresponding segments. Any IP addresses that don’t correspond to NSX objects are placed in the hierarchy group defined in the CSV file.
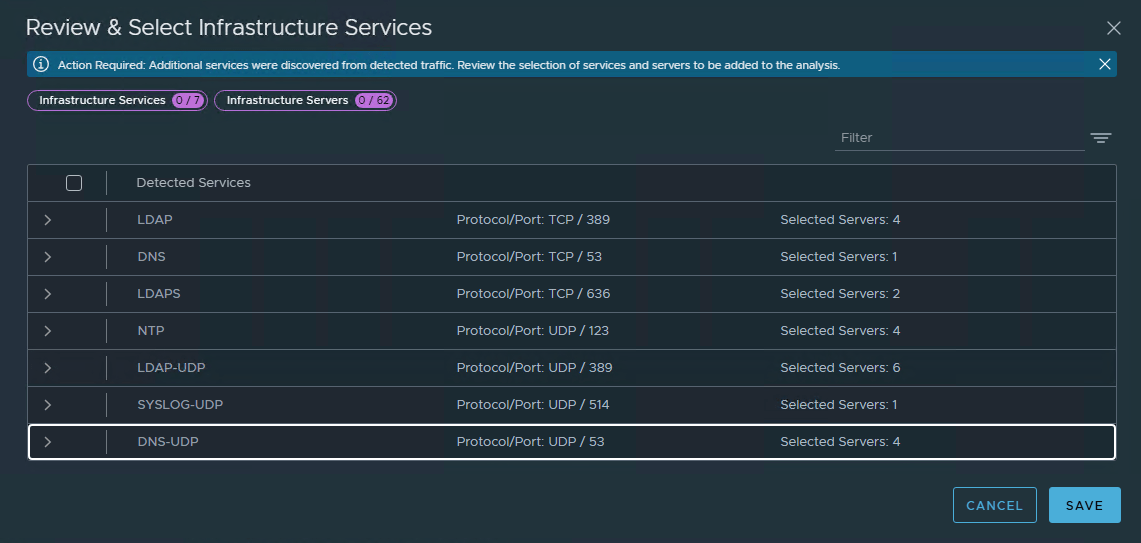
Click the Review & Select button to view the discovered services and servers from detected traffic, then identify and select which infrastructure services to include in the segmentation analysis.
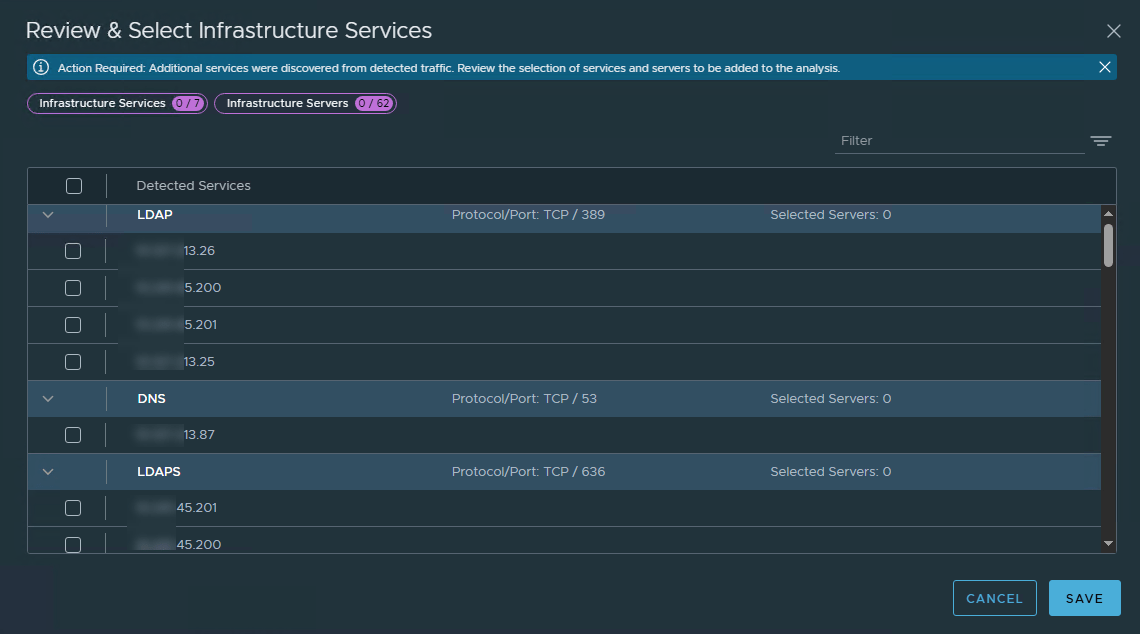
Unselect the IP addresses that were wrongly discovered as infrastructure services. Click Save to continue.
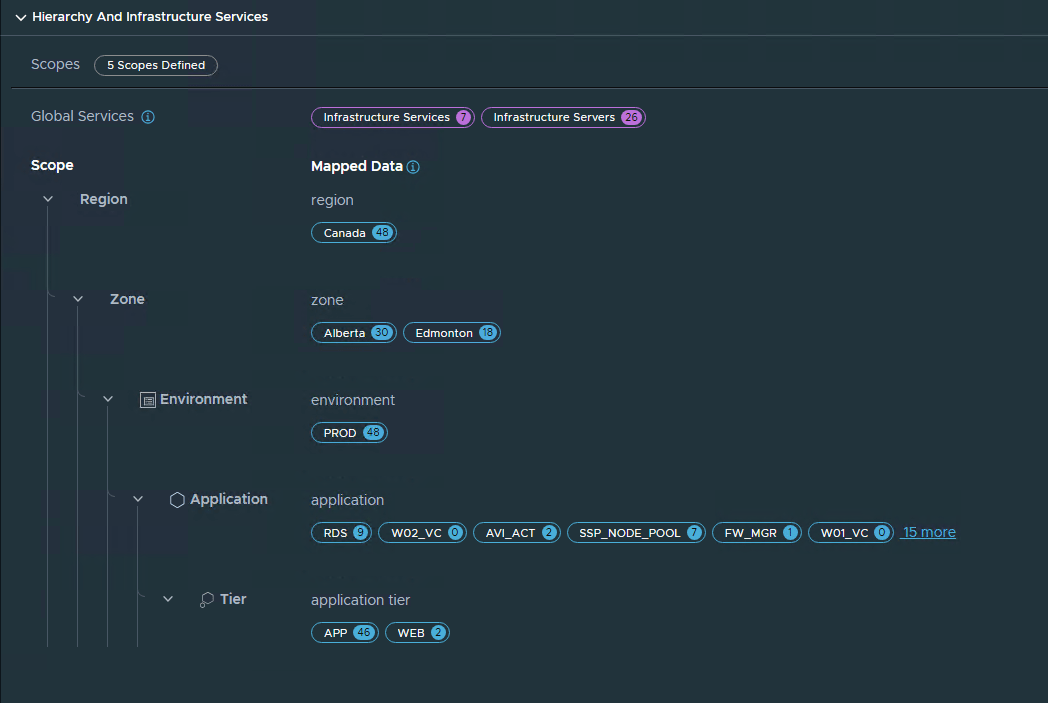
Asset Hierarchy
Each scope level (region, zone, environment, application, tier) displays the total number of assets included in that scope.
Click any tag to view the CSV row number, asset identifier, and asset type details.
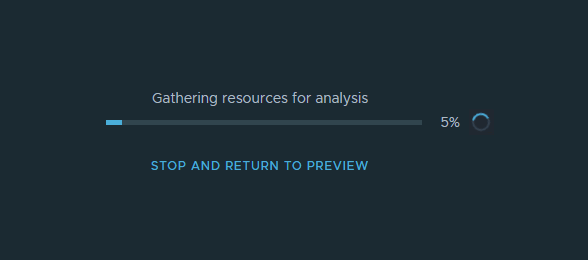
Click Start Analysis. The analysis can take a while to complete, depending on the size of the inventory asset data in the CSV file.
After the analysis is complete, a summary of the discovered assets is presented in the dashboard with an option to publish. You must review the mapped inventory asset information before publishing to the NSX Manager.
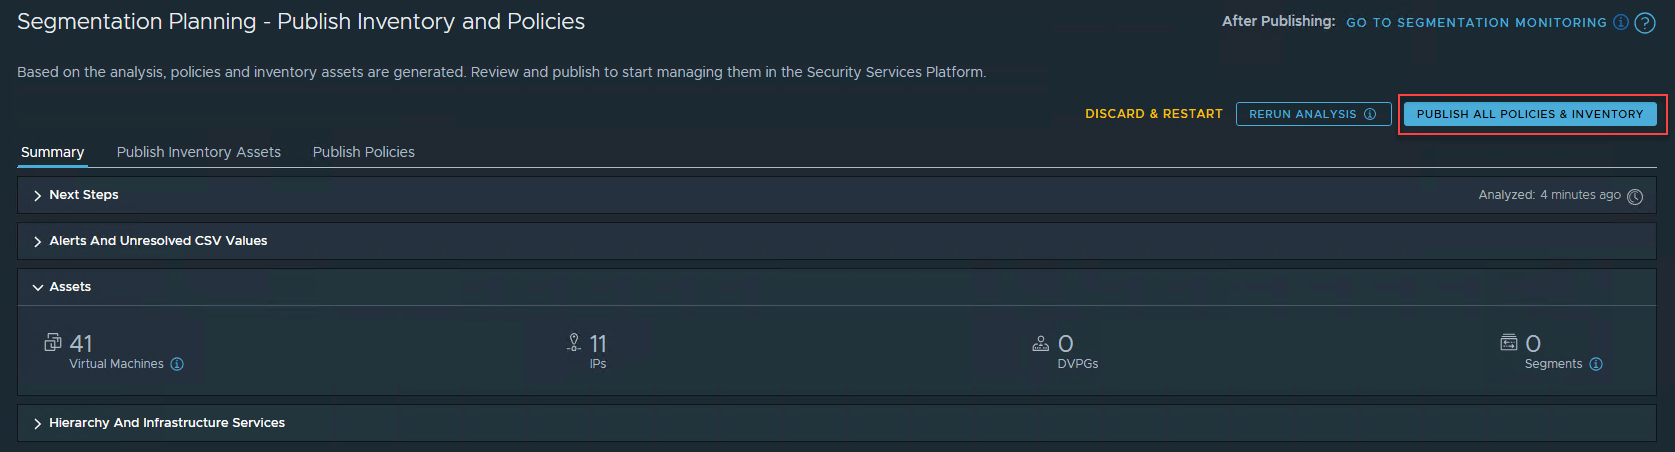
Publish Inventory & Policies
The summary tab displays the total number of inventory assets and policies available for publishing.
After the analysis is complete, the results are organized into two categories:
- Inventory Assets: infrastructure assets, regions and zones, environments, and applications.
- Policies: infrastructure policies/rules and environment policies/rules.
The following details from the imported CSV file are displayed:
- Tags: The total number of tags mapped for each scope.
- Members: The mapped VMs, segments, DVPGs, and IP addresses.
- Tiers: The mapped tiers for each application.
The publishing action performs one of the following:
- Create: Creates the group as a new asset in NSX Manager inventory if it doesn’t already exist.
- Refresh: Updates an existing infrastructure service group in NSX Manager inventory by adding missing tags for VMs, segments, DVPGs, IP addresses, or membership criteria.
- Promote: Used when a group exists in NSX Manager, but the CSV defines a new hierarchy. Promotion changes the group’s name and membership. The group is renamed according to the new hierarchy.
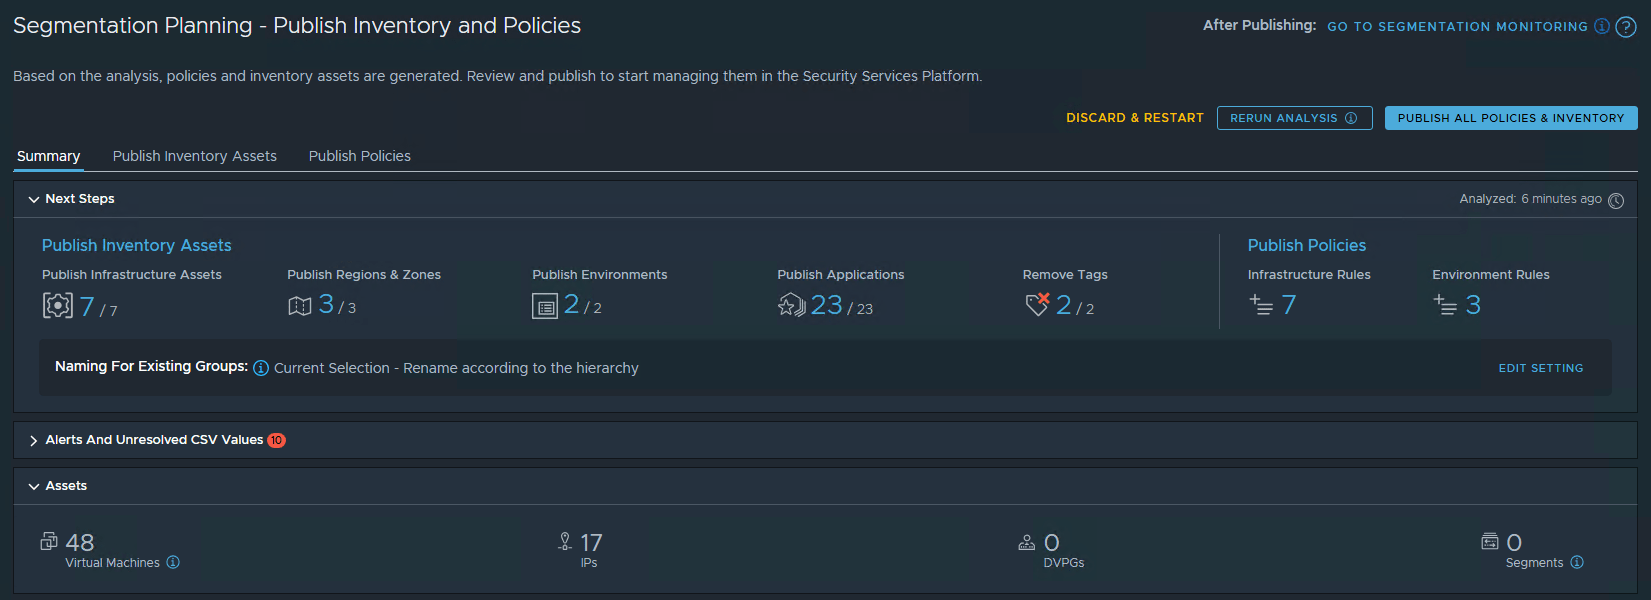
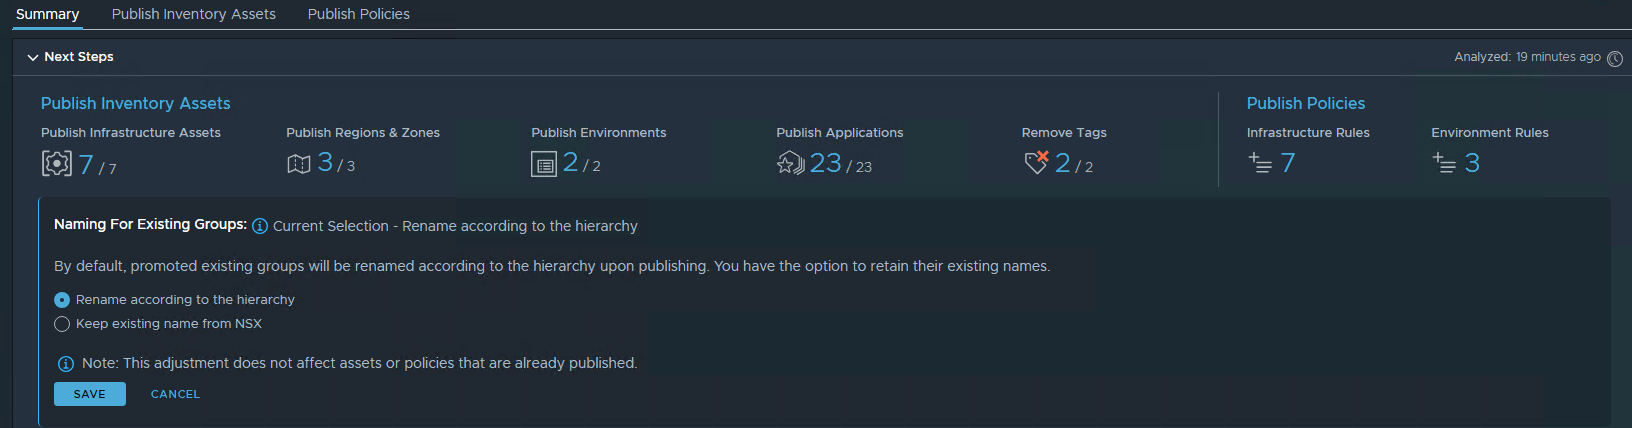
Decide whether to rename NSX Manager groups according to the hierarchy structure or preserve their existing names.
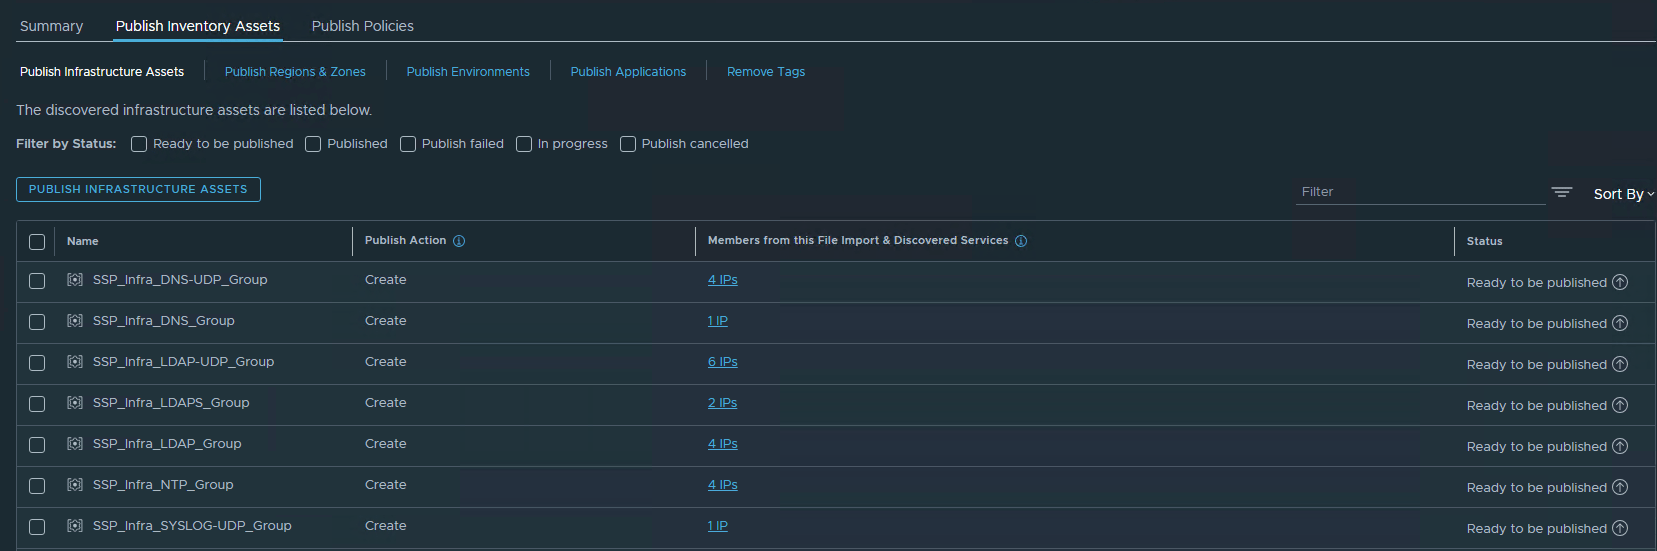
Review the infrastructure assets that will be published. The page displays the security groups that SSP will create and the total IPs and VMs contained in the security group.
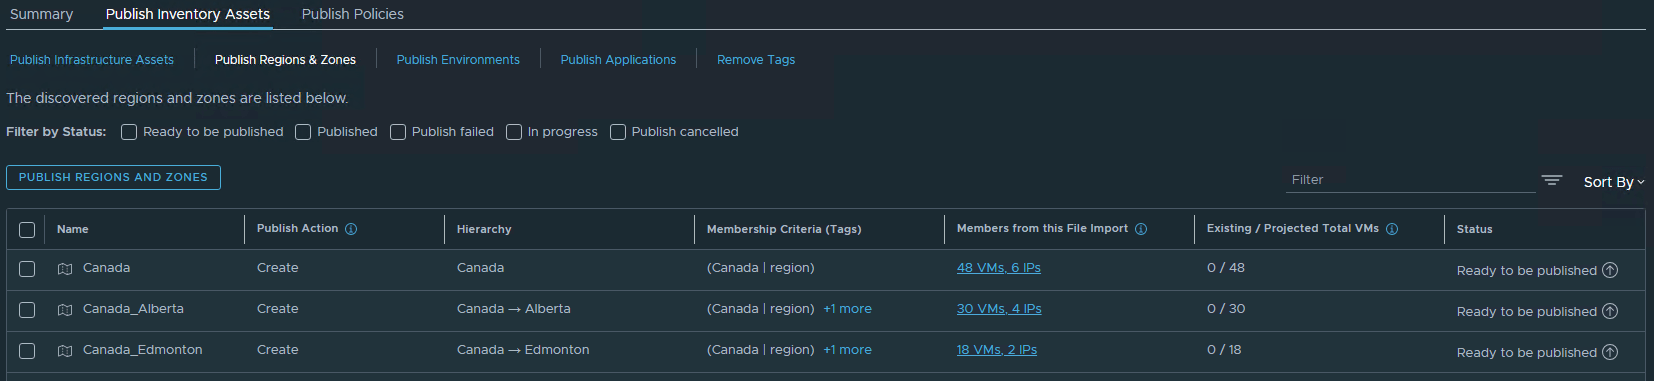
Publish Region & Zones
Review region and zone assets to publish and click the Publish button.
Publish Environments
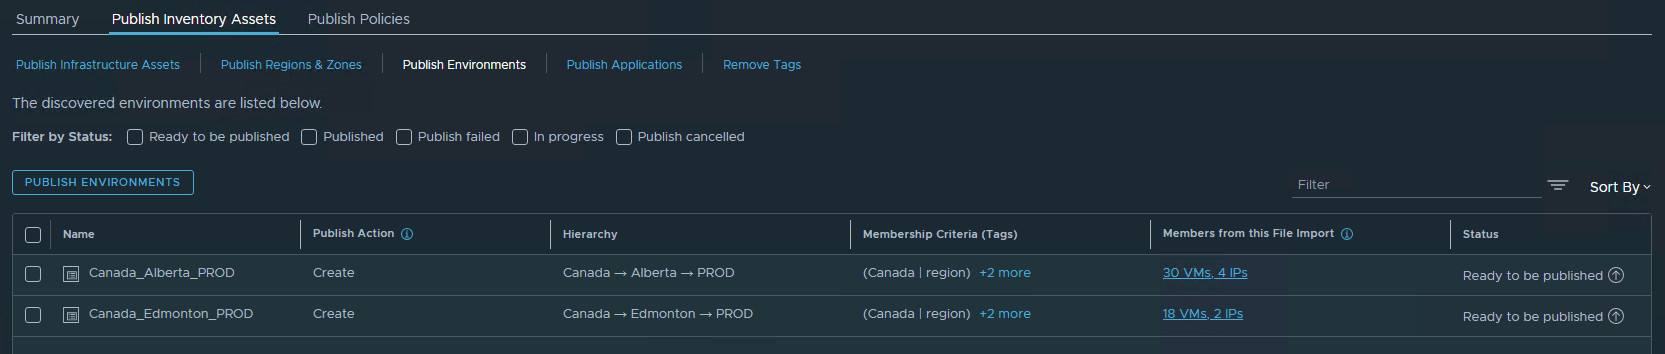
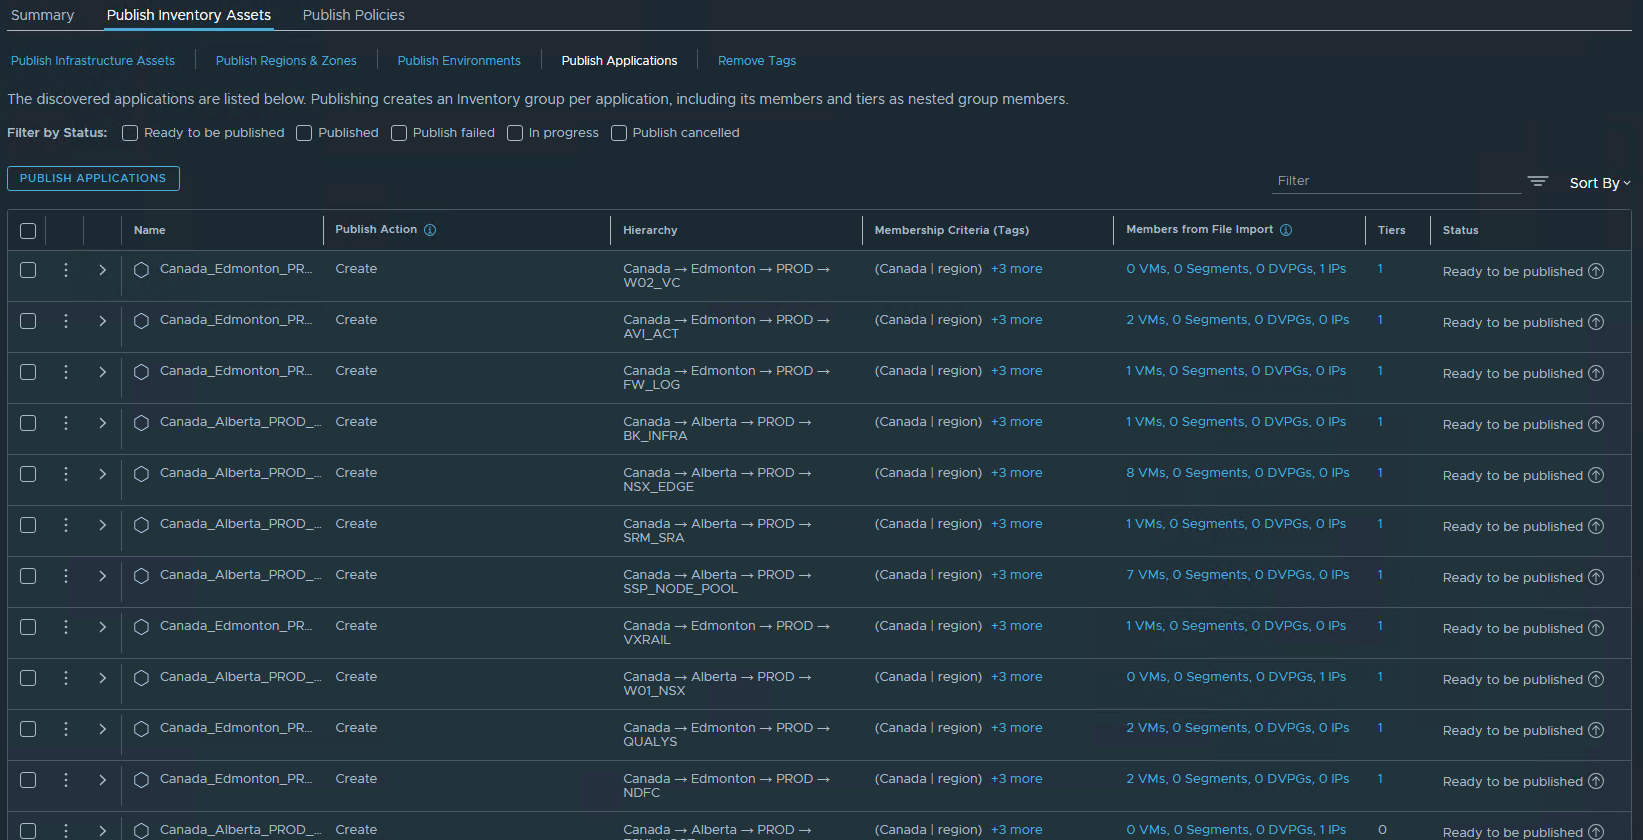
Publish Applications
Review the application assets by clicking the down arrow to expand and view the application type. You can also change the application type by clicking the three-dot option.
When you publish applications, an inventory group is created for each application with its members and tiers as nested group members.
Publish Policies & Rules
The Publish Policies option is divided into 2 parts:
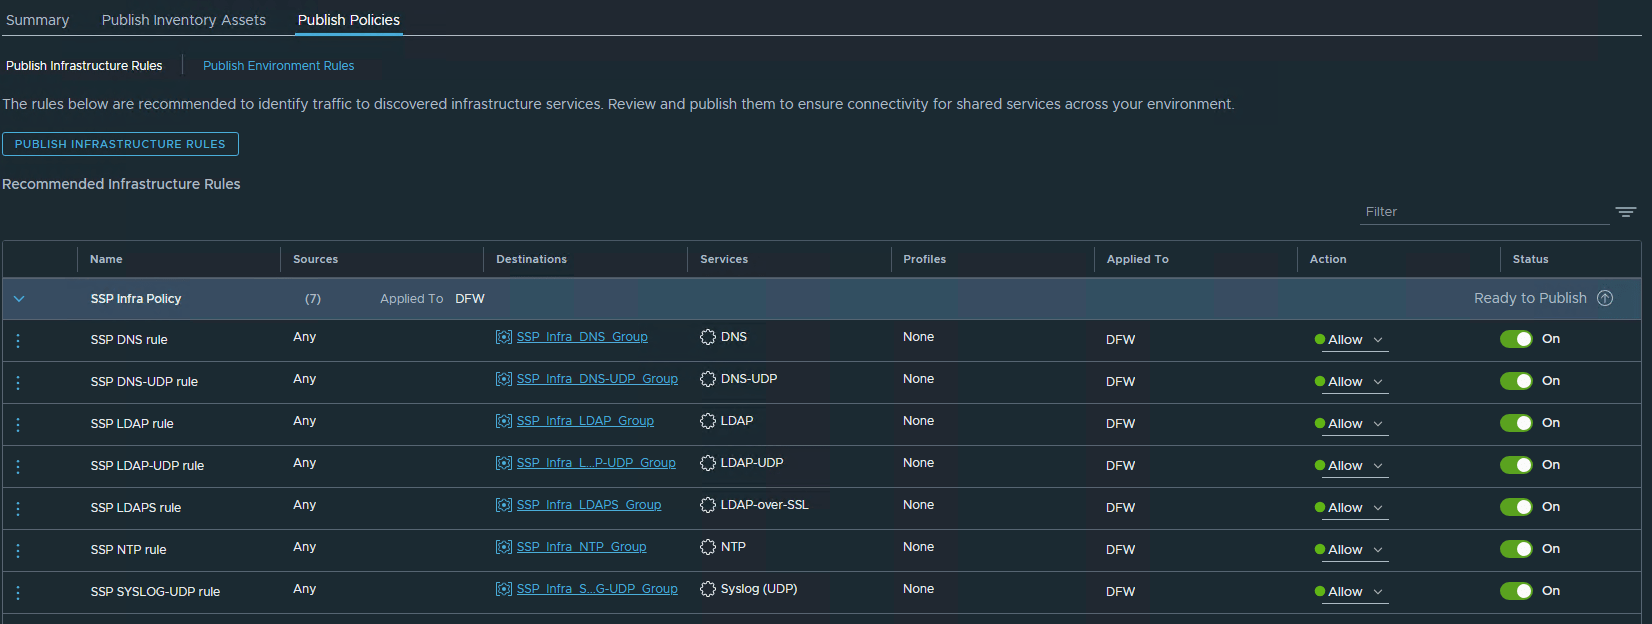
1: Publish Infrastructure Rules: Contains the list of firewall rules that are created for the infrastructure services.
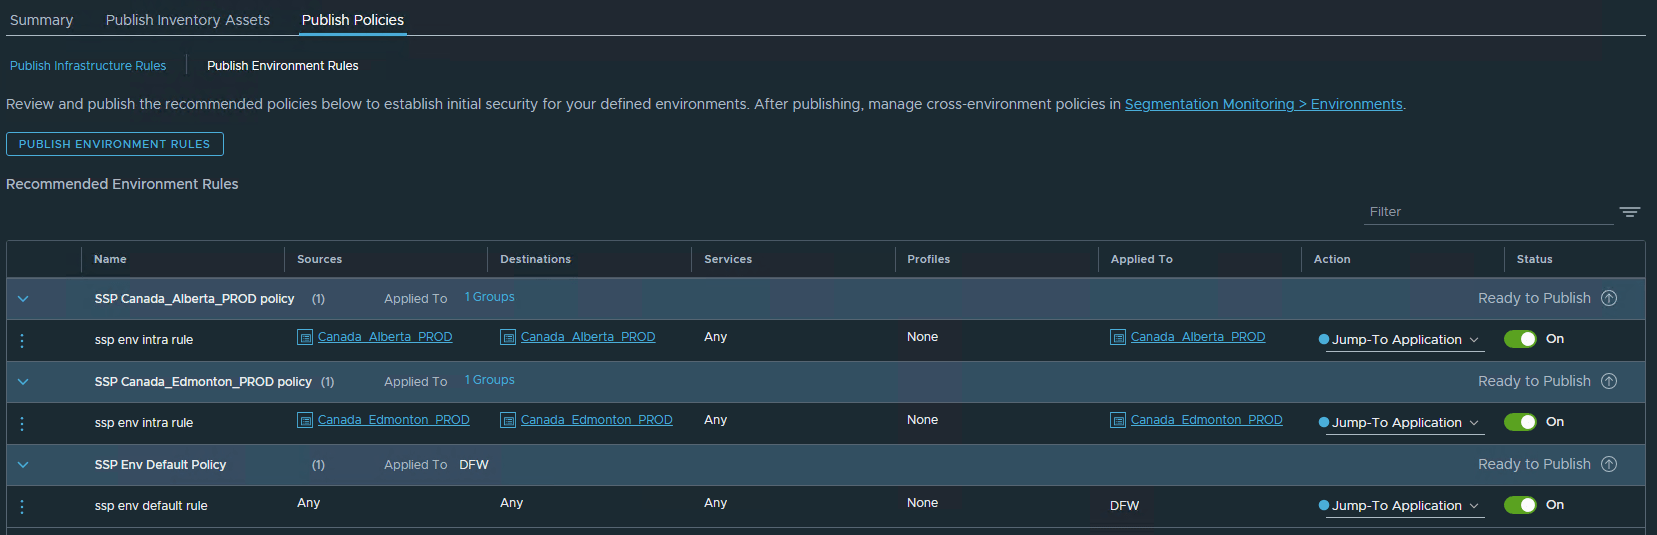
2: Publish Environment Rules: Contains intra-environment policies for each environment and the environment category default policy. This helps in configuring your initial security posture.
By default, the action is set to allow for all rules under the infrastructure policy. You can change the Action field from ‘Allow’ to ‘Drop’ or ‘Reject’ if it’s deemed necessary.
You can also delete a rule by clicking the three-dot menu.
Important Note: If you are using NSX Federation, you most likely have all core and shared infrastructure rules configured in your Global Manager. You can then choose to skip this part, as it will create duplicate rules.
Review and publish the environment rules.
By default, all environment rules are configured with the Jump-To-Application action, as the environment rules will be processed under the application blade in DFW. After you push the environment rules, you must implement a block rule to tighten the security posture.
Publish All Policies & Inventory
New SSP users should avoid using Publish All initially. Instead, publish inventory assets and tags individually to verify configurations before bulk publishing.
Verify that inventory assets have no tagging conflicts before publishing to avoid failures.
After the inventory assets and firewall policies are published, login to NSX Manager and verify that the objects have been created.
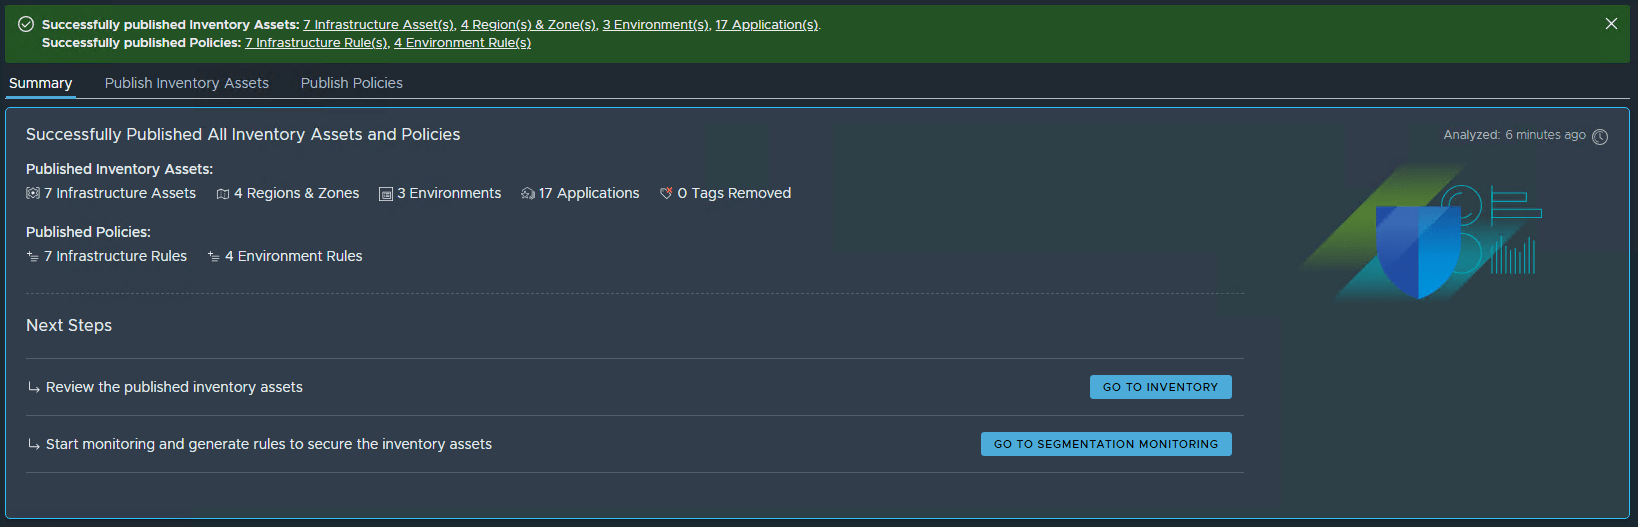
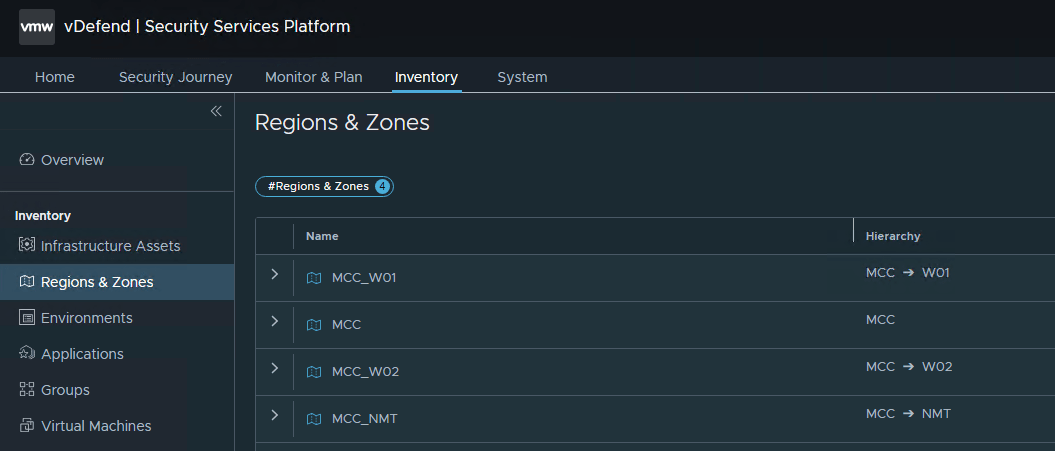
You can also verify the objects in SSP by clicking “Go to Inventory.”
The next step is segmentation monitoring, which I will cover in the next post of this series. Stay tuned!!!
I hope you enjoyed reading this post. Feel free to share this post on social media if it’s worth sharing.