In my last post of what’s new in vCAV 4.0 series, I discussed about SLA Profiles. In this post I will talk about another cool feature that tenants/providers are gonna get with 4.0.
vCAV 4.0 has ability to counts the traffic data transferred by each virtual machine that is replicating to cloud and aggregates the traffic volume information per organization. Service Provider can monitor the traffic for every replication bi-directionally and per organization individually.
How Traffic Monitoring Collection Works?
Below is high level workflow of how traffic monitoring mechanism work behind the scenes:
1: vCAV Replication Manager Service collects the traffic information for all replications to and from cloud sites and to and from on premises sites. The traffic information is aggregated by organization.
2: The cloud Replicator Service instance always collects the replication data traffic, for any replication direction. If a replication was configured with compress option, the Replicator Service counts the compressed bytes.
Note: The traffic count includes the replication protocol overhead and TLS overhead and excludes TCP/IP/Ethernet/VPN overhead.
3: Replication Manager Service records the historical traffic info to its persistent storage which was collected from all connected Replicator Service instances. This write is performed every 5 minutes.
Traffic Monitoring Retention
Tenants and SP’s can access both live and historical traffic information for virtual machine replications. SP’s can additionally access historical data per organization.
If you are interested in reading traffic reports for a specific period then you can do so by specifying start and end time.
Typically vCAV stores the historical traffic information for the following intervals:
- 5 minutes intervals, available for the last 5 hours.
- Hourly intervals, available for the last 14 days
- Daily intervals, available for the last 60 days
Monitoring Replication Traffic as Tenant
Tenants can see traffic data chart of their organization only. The chart shows the bytes of transferred data for the last five hours, up to two months.
Note: The traffic information is available for virtual machines and is not available for vApps.
Tenants can view traffic chart by logging into vSphere web client and navigating to Home > DRaaS > Dashboards
Exporting Organization Replication Traffic
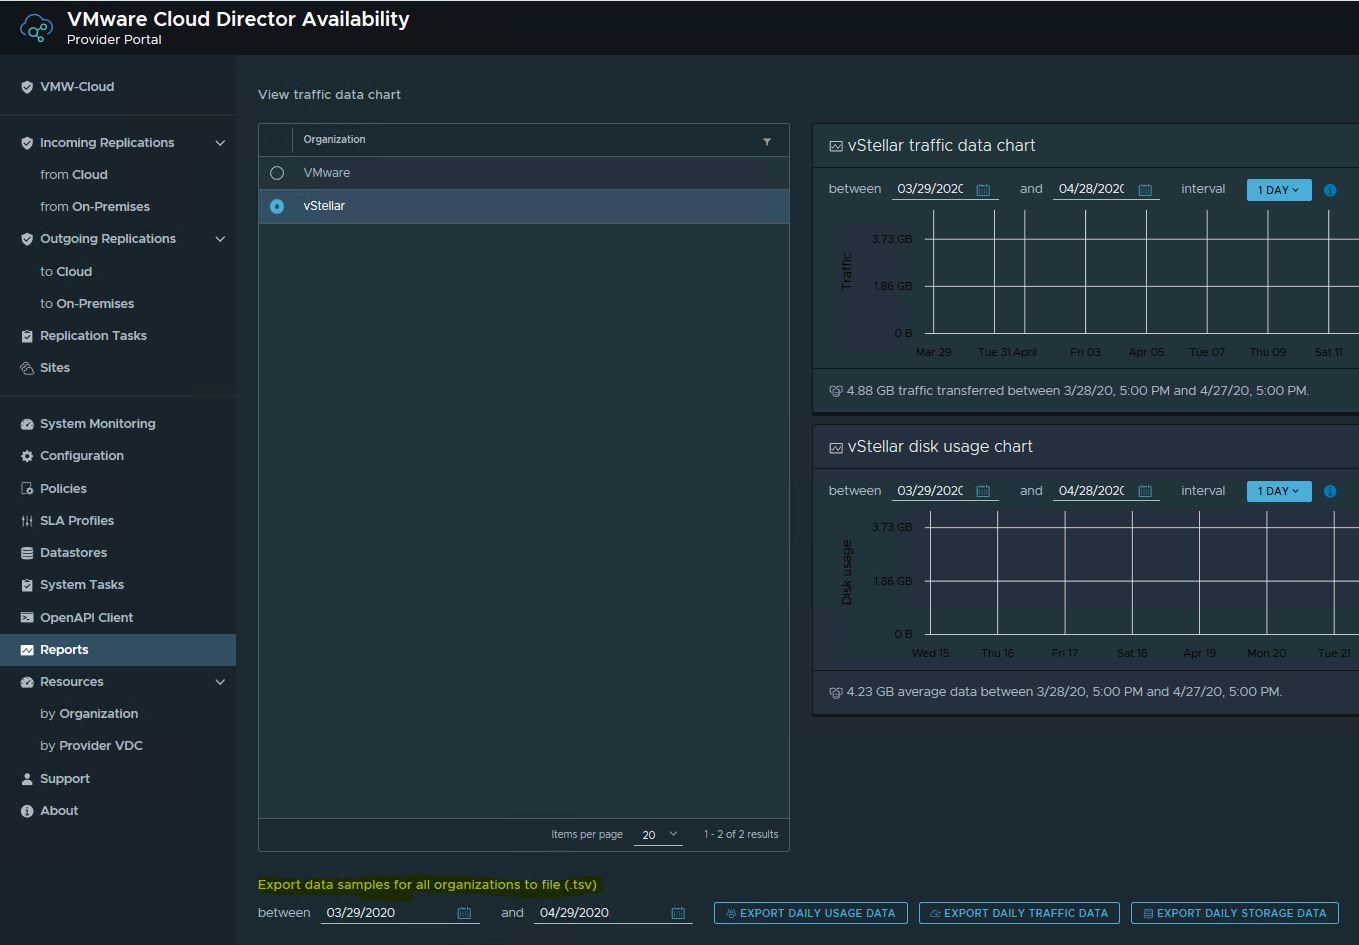
Service Provider can replication traffic data for all organizations and also have ability to export data samples for a given period to a file that contains daily usage or traffic data.
This can be done by connecting to Provider portal (https://vcav-cloud-fqdn/ui/admin) and navigating to Home > Reports and selecting a specific organization.
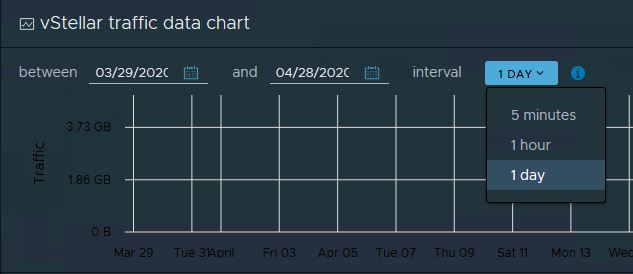
In the organization traffic data chart, enter the beginning and the end of the traffic reporting period, and select the interval of reporting.
Monitoring Individual VM Replication Traffic
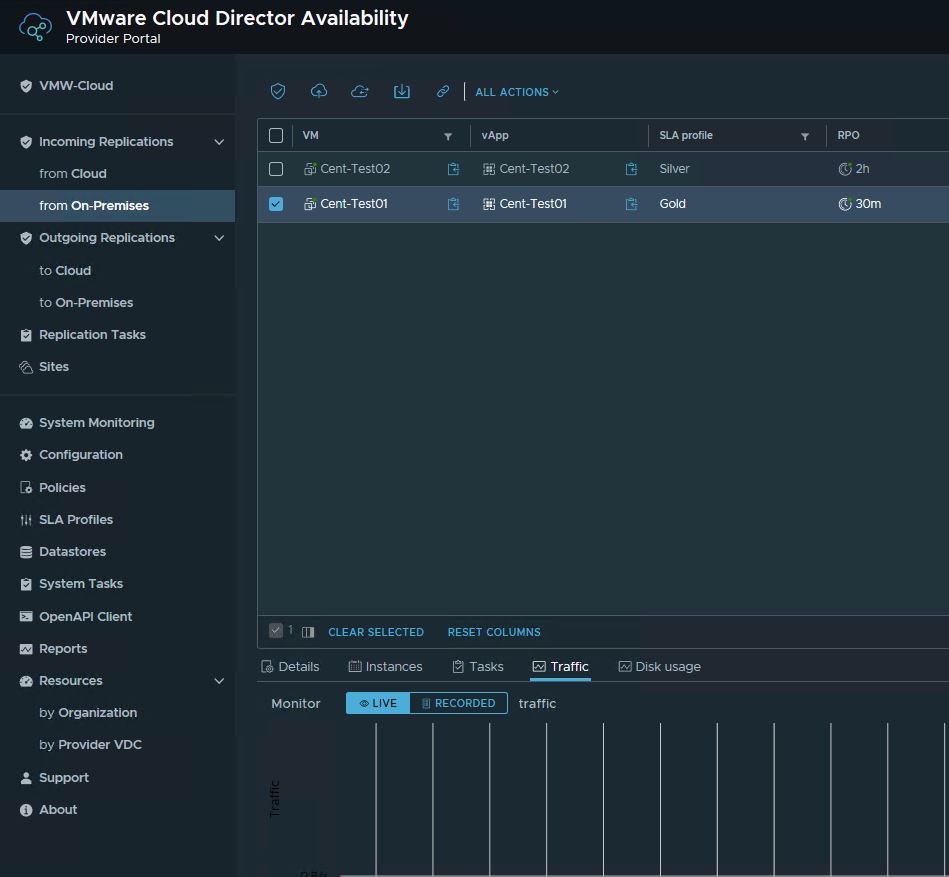
Tenant and SP’s can monitor replication data of a specific VM in both real time and historical one. This can be monitored from service provider portal by navigating to Incoming or Outgoing Replications > from cloud or on-premise > VM > Traffic
And that’s it for this post. Stay tuned for more blogs from this series.
I hope you enjoyed reading this post. Feel free to share this on social media if it is worth sharing 🙂


